Fig. 5.
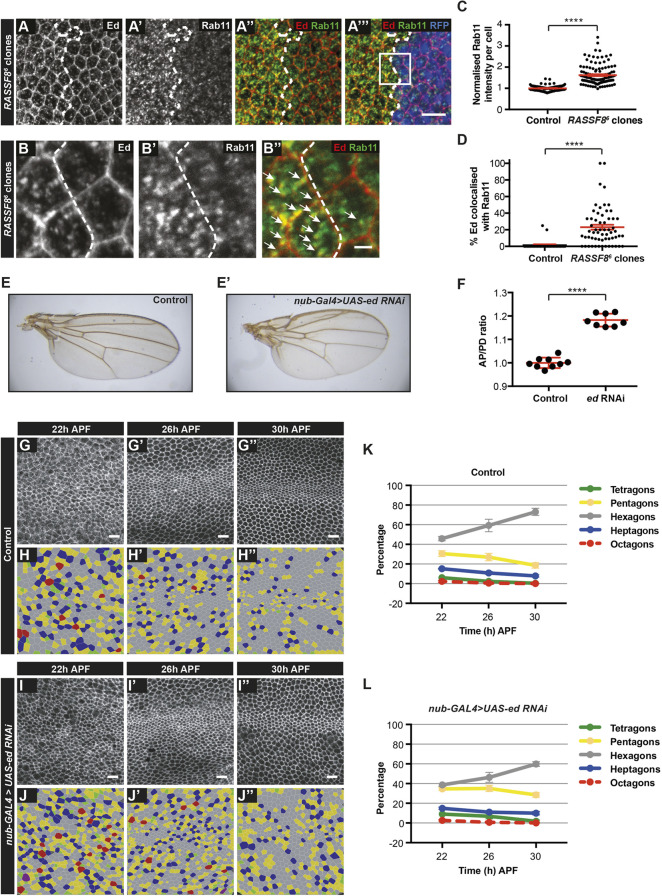
Ed accumulates in Rab11 compartments in RASSF8 mutants. (A-A‴) Accumulation of Ed and Rab11 in RASSF8 mutant clones. Ed (red) and Rab11 (green) antibody staining in RASSF8 mutant clones (marked by absence of RFP in blue). Clone boundaries are marked by white dotted lines. (B-B″) Zoomed-in views of the images in A-A‴ (see box in A‴) with colocalisation of Ed and Rab11 indicated by white arrows. Ed/Rab11-positive compartments are present both in the medial cytoplasm and at the apical plasma membrane. (C) Quantification of the total intracellular Rab11 fluorescence per cell in control (RFP+) or RASSF8 mutant (RFP−) cells. The RASSF8 mutant values were normalised to the control values. Data are mean±s.e.m. n>44 cells from three different wings. Two-tailed Student's t-test: ****P<0.0001. (D) Quantification of the percentage of Ed colocalised with Rab11 per cell in control (RFP+) or RASSF8 mutant (RFP−) cells. Data are mean±s.e.m. n>34 cells from three different wings. Two-tailed Student's t-test: ****P<0.0001. (E) Control wing. (E′) nub-Gal4 driven UAS-ed-RNAi wing. (F) Quantification of relative wing roundness (ratio of AP to PD axis, normalised so that wild-type ratio=1). Data are mean±s.d. Two-tailed Student's t-test: ****P<0.0001. (G-J″) Hexagonal cell packing of control and nub-Gal4-driven ed-RNAi wings at 22, 26 and 30 h after puparium formation (APF). Confocal images of a region straddling the L3 vein (green rectangle in Fig. 1A) of control (G-G″) and ed-RNAi (I-I″) pupal wings stained using anti-Arm antibodies. Colour-coded images indicate the number of neighbours for each cell in control (H-H″) and ed-RNAi (J-J″). (K,L) Percentage of cells with four, five, six, seven or eight neighbours (colour coded as indicated) in control (K) and ed-RNAi (L) wings. The red line (octagons) is dashed so the green line (tetragons) can be seen. Data are mean±s.d. n=1600-4600 cells from four to eight individual wings. Scale bars: 10 μm in A-A‴,G-G″,I-I″; 2 μm in B-B″. See Table S2 for raw data.

