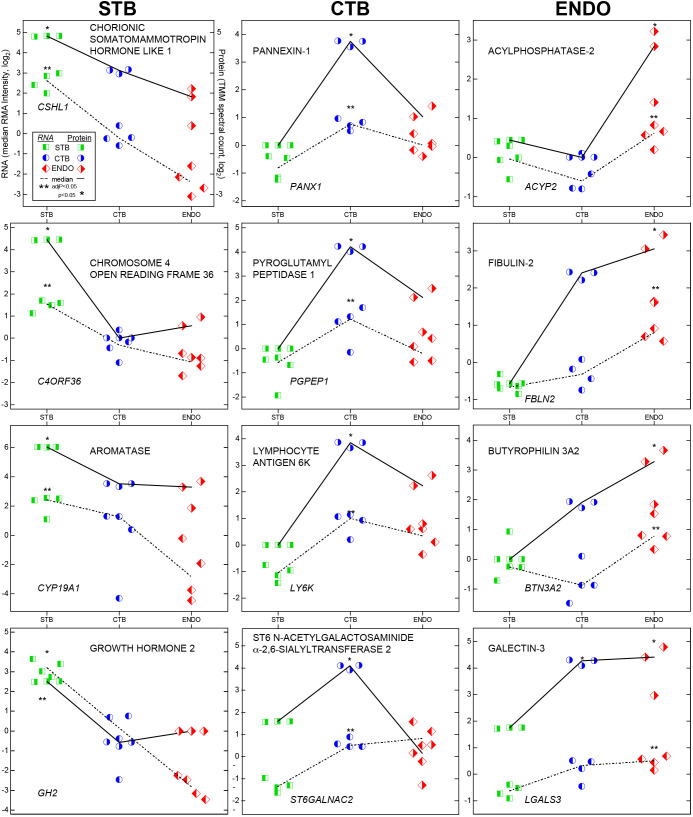
Fig. 3.
Plots of relative RNA and protein abundances in trophoblast subtypes. The upper left hand panel illustrates the labeling scheme. Data are organized in columns. Molecules that were upregulated in STBs are shown to the left, cell column CTBs in the middle and endovascular CTBs to the right. Each cell type is designated by a different bisected symbol (square, circle or diamond). Left or right shading denotes RNA or protein values, respectively, which is colored (green, blue or red) to aid interpretation. RNA data were from four biological replicates, protein data were from three biological replicates.

