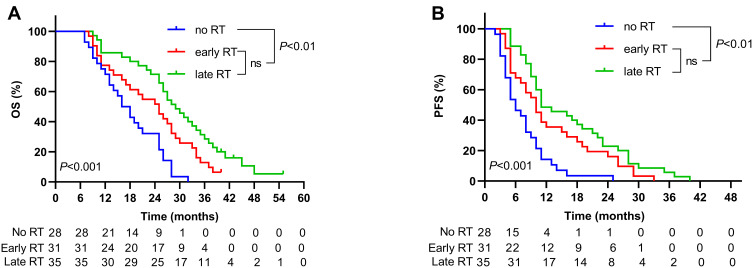
Figure 1.
Survival curves. (A) OS and (B) PFS are shown for three groups. Both of the RT groups had better OS and PFS than no RT group (P<0.01) and there was no significant difference in OS and PFS between the two RT groups (P>0.017).
Abbreviations: RT, radiotherapy; OS, overall survival; PFS, progression-free survival; ns, not significant.

