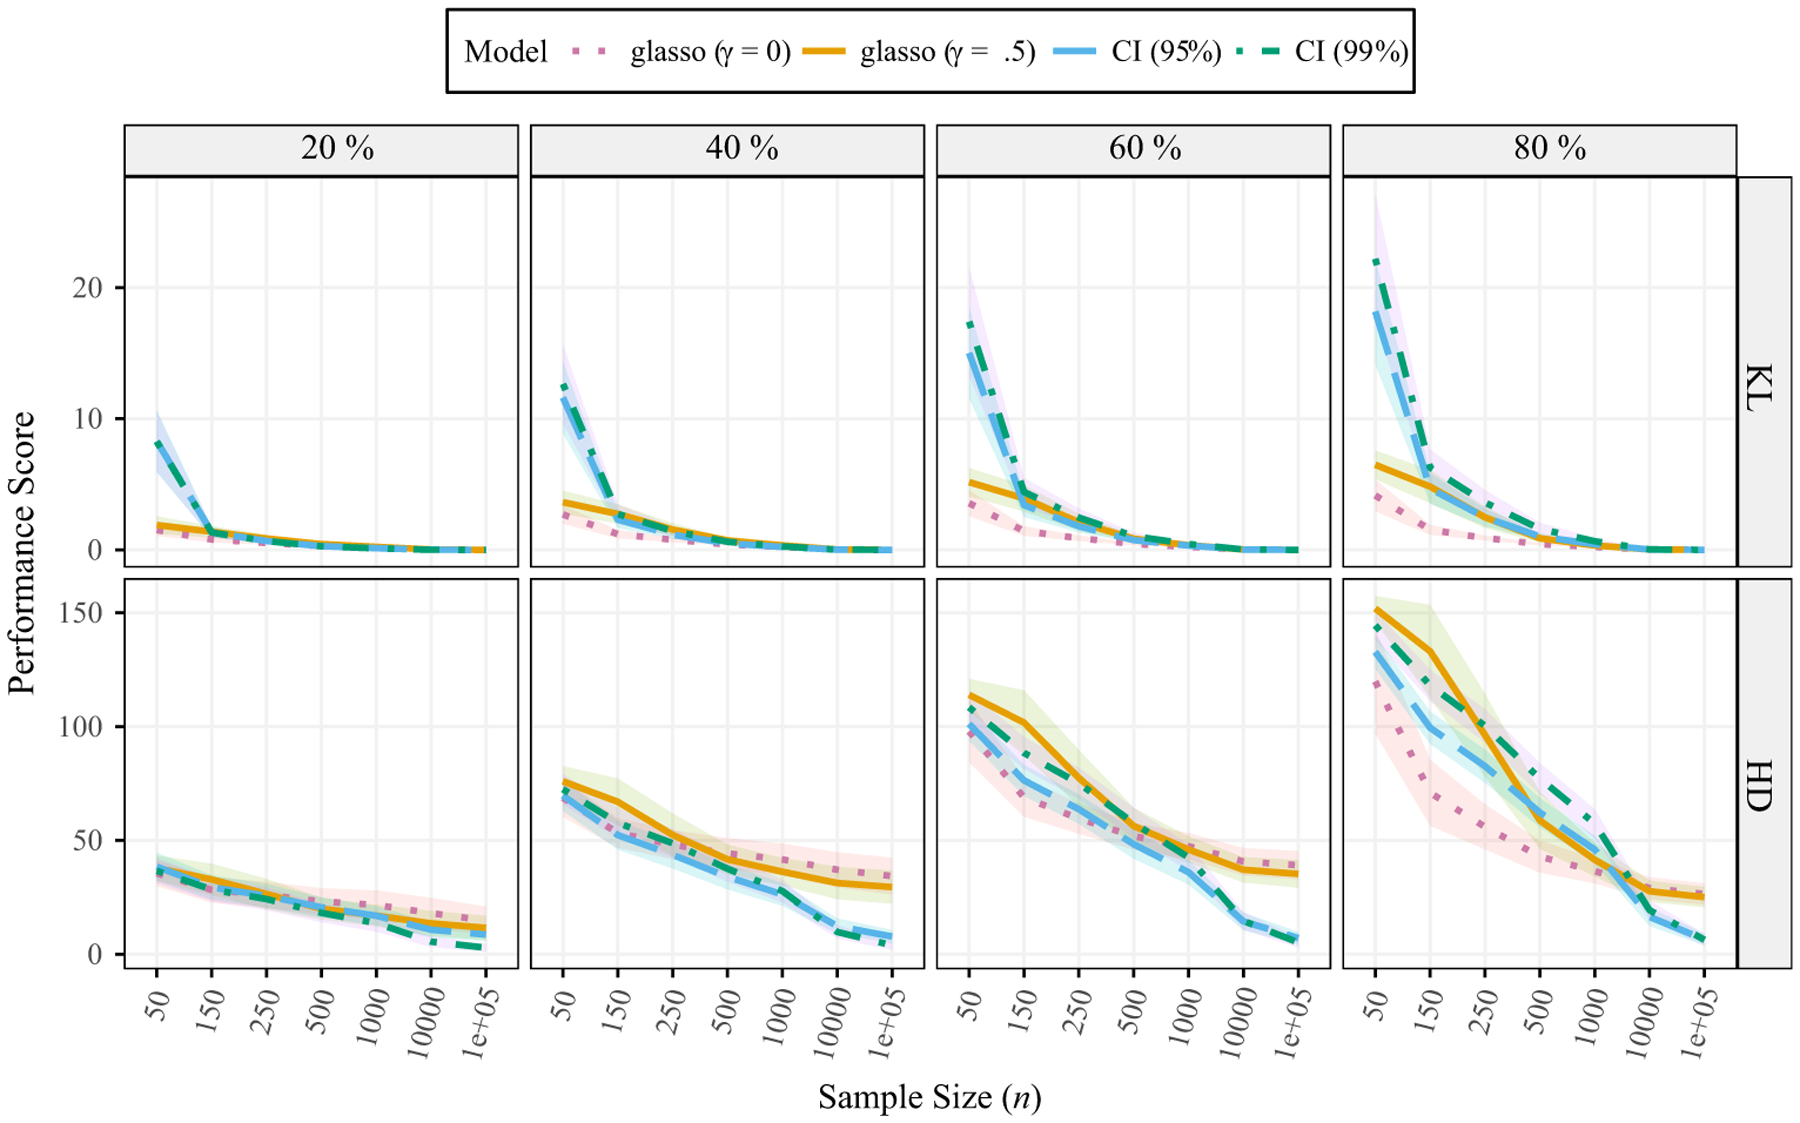
Figure 3.

Risk of the estimated precision matrices. Lower scores are closer to the true network. The probability of a connection varies from 20% to 80%. γ denotes the EBIC parameter (equation 5). EBIC = extended Bayesian information criterion; HD = Hamming distance; KL = Kullback–Leibler divergence. The ribbons are ±1 SD.
