Figure 1.

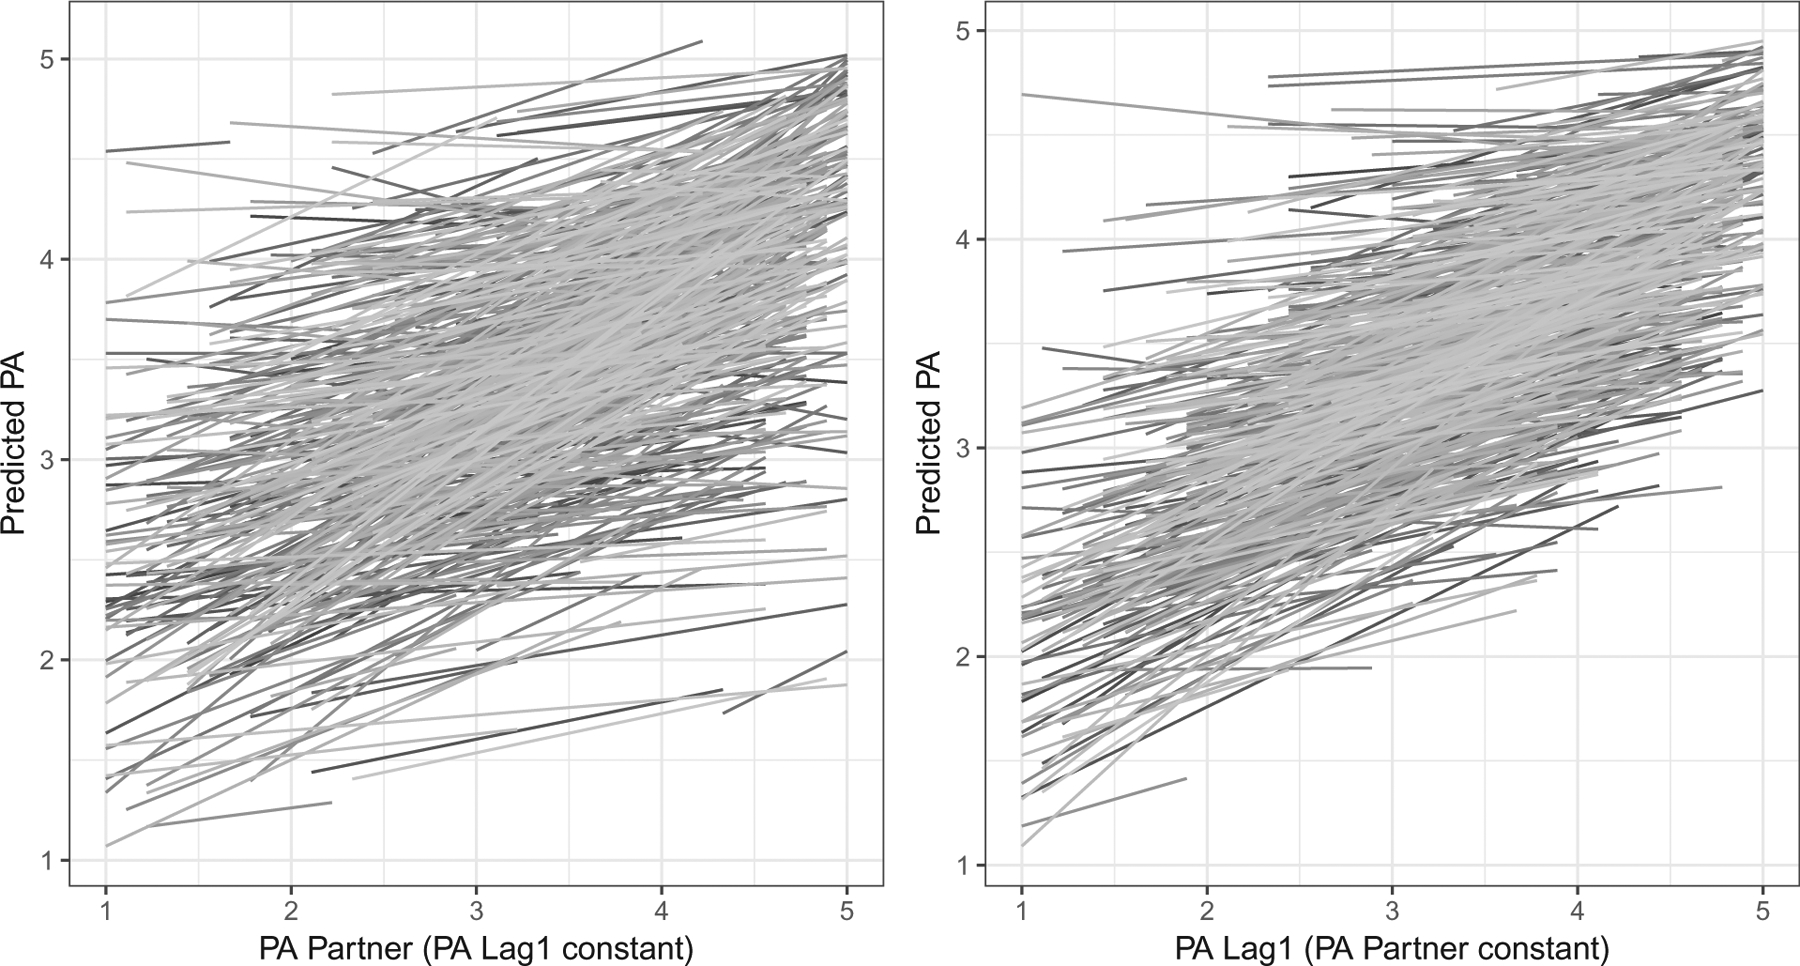
Predicted slopes of positive affect versus PA Lag 1 (PA partner) holding the PA partner (PA Lag 1) effects constant at the person-level. Each line represents the predicted line for an individual.

Predicted slopes of positive affect versus PA Lag 1 (PA partner) holding the PA partner (PA Lag 1) effects constant at the person-level. Each line represents the predicted line for an individual.