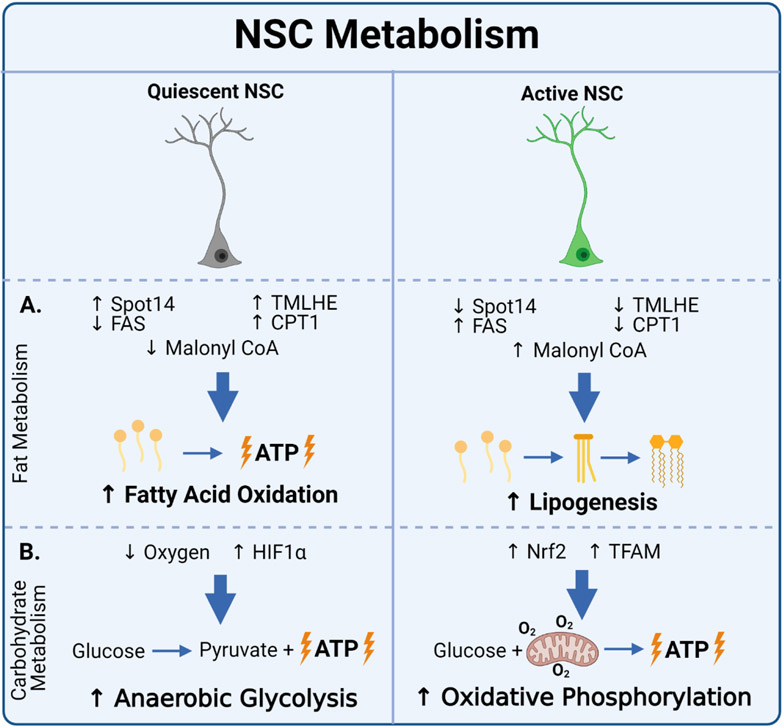
Figure 2. NSC Metabolism.
(A) Fat metabolism: Quiescent NSC’s exhibit increased fatty acid oxidation (characterized by increased Spot14 expression, TMLHE expression, and CPT1 activity, and decreased FAS expression and malonyl CoA levels). Active NSC’s exhibit increased lipogenesis (characterized by decreased Spot14 expression, TMLHE expression, and CPT1 activity, and increased FAS expression and malonyl CoA levels). Spot14 = thyroid hormone response protein 14; TMLHE = trimethyllysine hydroxylase epsilon; CPT1 = Carnitine palmitoyltransferase I; FAS = fatty acid synthase;. (B) Carbohydrate metabolism: Quiescent NSC’s regulated by HIF1α rely primarily on anaerobic glycolysis. Active NSC’s exhibit primarily oxidative phosphorylation, characterized by elevated TFAM and NRF2 expression. HIF1α = hypoxia-inducible factor 1α; Nrf2 = nuclear response factor 2; TFAM = mitochondrial transcription factor A. Created with BioRender.com.

