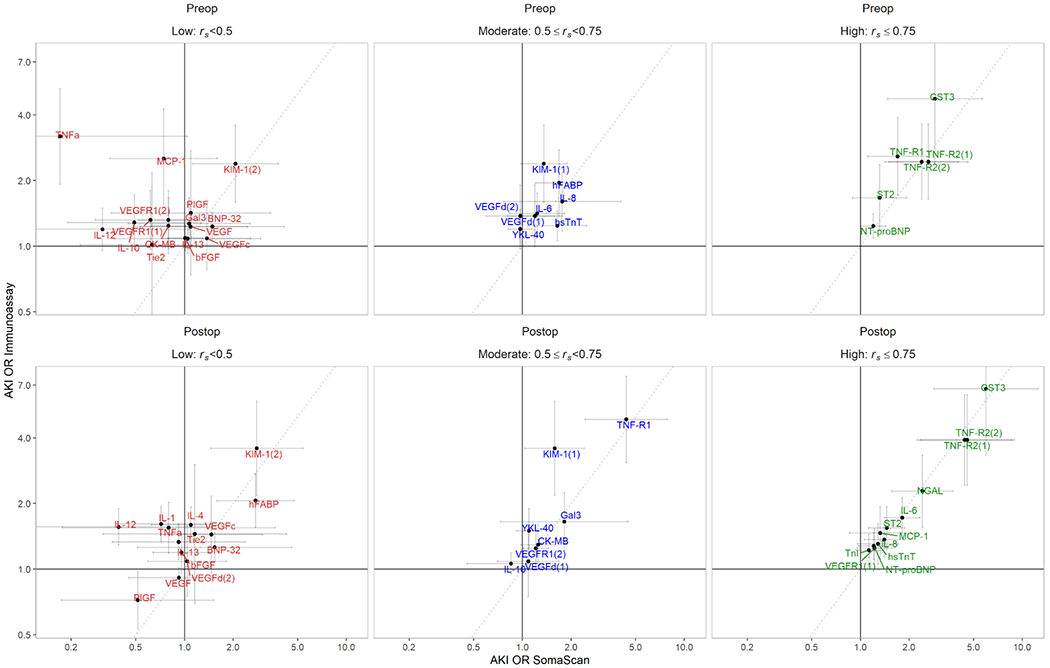
Figure 1. Biomarker-AKI ORs by platform for each inter-platform correlation group.

Biomarker-AKI associations were more similar in postoperative (Postop) plasma samples (bottom panels) than preoperative (Preop) plasma samples (top panels). Biomarkers with high inter-platform correlation (right panels, green) tended to have more consistent biomarker-AKI ORs per doubling between platforms than moderate- (blue, center) and low-correlation (left, red) biomarkers. Scatterplots of biomarker-AKI ORs per doubling, as measured by immunoassay (y-axis) and SomaScan (x-axis) platforms. Error bars represent 95% CIs for ORs. The dotted gray lines represent the identity (y = x) line. Preop/low-correlation TNFa SomaScan error bar and both Preop and Postop/high-correlation CST3 immunoassay error bars are truncated for visualization purposes.
