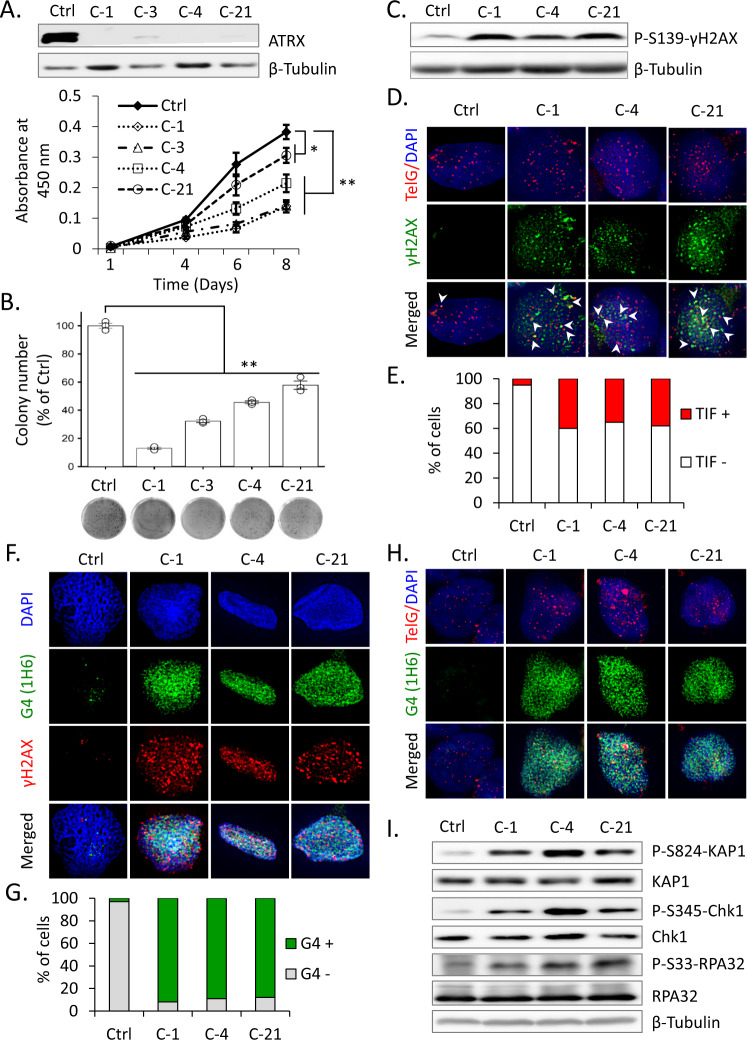
Fig. 1. ATRX loss induces G4 formation and RS in TP53 wt NGP cells.
A Western blots show the depletion of ATRX protein expression in cell lysates prepared from Cas9 control (Ctrl) and ATRX KO (C-1, C-3, C-4, and C-21) NGP cells. β-Tubulin was used as a loading control. Lower panel, growth curves show that viability was lower in ATRX KO NGP cells than in Ctrl cells. Data are expressed as means ± standard deviation (SD), N = 3. A two-way ANOVA followed by a multiple comparison Bonferroni post hoc test was used to compare differences between groups (*p < 0.05 and **p < 0.01). B Clonogenic assay of Ctrl and ATRX KO NGP cells demonstrating the weaker proliferative abilities of KO cells than Ctrl cells. Lower panel, representative images for clonogenic formation are shown. Error bars represent SD from three technical replicates. **p < 0.01; A one-way ANOVA with Dunnett’s and Tukey’s test were used for statistical analyses. C Immunoblot showing activation of the DDR upon the depletion of ATRX, including the phosphorylation of histone H2AX on Ser-139 (γH2AX). D, E γH2AX/TelG immuno-FISH (D) shows increased TIF (telomere dysfunction-induced foci) in ATRX KO NGP cells. Arrows denote the colocalization of telomeric foci (red) and γH2AX signals (green). Cells were also stained with DAPI to visualize nuclei (blue). E Quantification of TIF+ cells among 100 cells analyzed in (D). F, G Coimmunofluorescence staining of ATRX-intact (Ctrl) and ATRX KO NGP cells with the anti-G-quadruplex (G4) antibody, 1H6 and anti-γH2AX. G Quantification of G4+ cells among 100 cells analyzed in (F). H G4 (1H6)/TelG immuno-FISH reveals colocalization of G4 on telomeric region in ATRX KO NGP cells. Nuclei are counterstained with DAPI (blue). I Representative immunoblot analysis of p-KAP1 (Ser-824), KAP1, p-Chk1 (Ser-345), Chk1, p-RPA32 (Ser-33), and RPA32, showing the activation of RS arising from ATRX deficiency. β-Tubulin served as a loading control.

