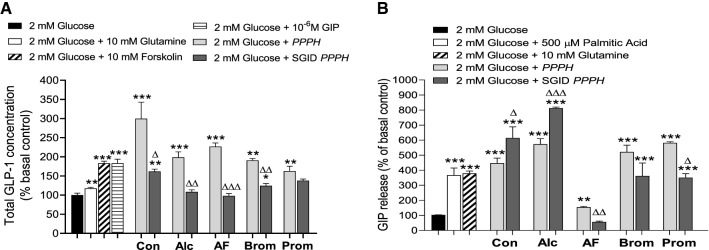
Fig. 3.
Effects of fixed concentration (2.5 mg/mL) of PPPH on the incretin effect through (a) GLP-1 release from GLUTag cells and (b) GIP release from STC-1 α-cells. Values are mean ± SEM (n = 4). p < 0.05, **p < 0.01, ***p < 0.001 compared to 2 mM glucose controls (a, b). Δp < 0.05, ΔΔp < 0.01, ΔΔΔp < 0.001 compared to the appropriate, non-SGID hydrolysate (a, b). Con: aqueous/alkaline control, AF: Alcalase/Flavourzyme, Alc: Alcalase, Brom: Bromelain, Prom: Promod

