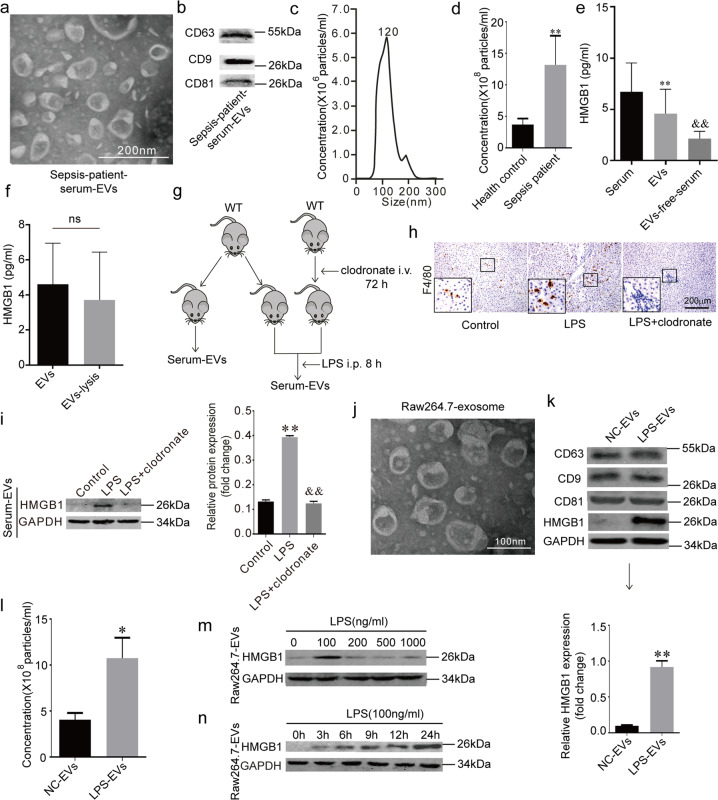
Fig. 1. Macrophages contribute to the HMGB1 release by EVs.
a TEM (transmission electron microscopy) of serum-derived EVs (extracellular vesicles) from sepsis patients. Scale bar = 200 nm. b Biomarkers of sepsis patient serum EVs. Immunoblots are representative of three separate experiments. c, d Size distribution and number of EVs analyzed by NTA. e Serum-HMGB1, EVs-HMGB1 and EVs-free-serum HMGB1 levels in the sepsis patients. (**) P < 0.01 versus Serum group; (&&) P < 0.01 versus EVs group. f EVs HMGB1 and EVs-lysis HMGB1 levels in the sepsis serum, ns: no significance. g Macrophages were cleaned out with clodronate for 48 h and exposed to LPS for another 8 h, serum-derived EVs were collected. h F4/80 staining in all groups; Scale bar = 200 μm. i HMGB1 level in serum-derived EVs in all groups, the proteins were normalized by GAPDH, (**) P < 0.01 versus control-EVs group; (&&) P < 0.01 versus LPS-EVs group. j TEM of Raw264.7 EVs. Scale bar = 100 nm. k EVs biomarkers and HMGB1 in Raw264.7 derived EVs. Immunoblots are representative of three separate experiments. l Number of EVs analyzed by NTA. m HMGB1 in Raw264.7 derived EVs exposed to different concentrations of LPS protein was normalized to GAPDH protein. Immunoblots are representative of three separate experiments. n EVs HMGB1 and levels in the LPS-induced macrophage culture medium at different time points. (*) P < 0.05 versus 0 h group; (**) P < 0.01 versus 0 h group.

