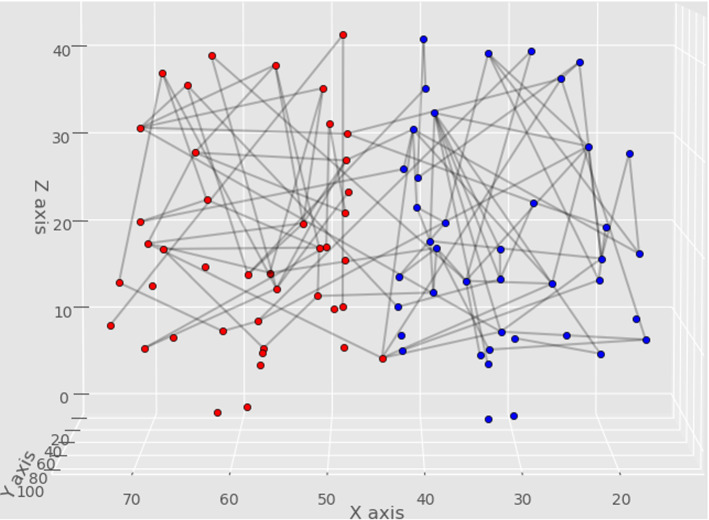
Fig. 2.
A braingraph of a subject, with 83 vertices and the 102 edges, whose weights (i.e., fiber numbers) already determine the sex of the subject. Labels on the axes are voxel coordinates in mm. In the 102-dimensional space, the male- and female braingraphs are perfectly separated by a hyperplane, similarly as the green line separates the blue and red dots in Fig. 1. The nodes from the distinct hemispheres are colored differently; the frontal lobe is on the top of the figure. The list of these 102 edges is given in Supporting Table 1 in the supporting material. An Excel file performing the actual separation-computation with all data is available at http://uratim.com/agysvm/agy-svm.zip. An interactive chart visualizing the separation can be viewed at http://pitgroup.org/static/interactive_chart/abra.html. (Color figure online)

