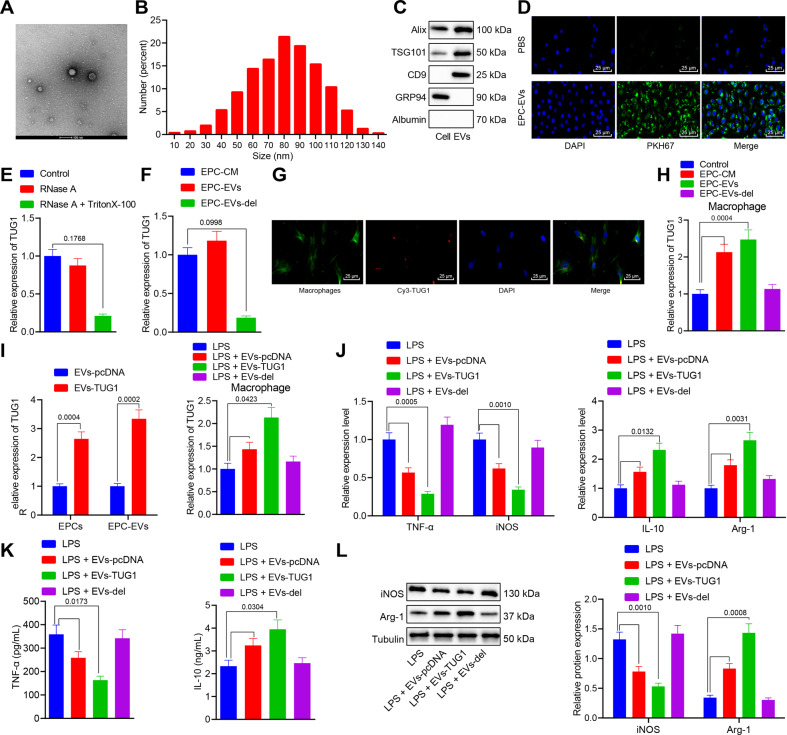
Fig. 3. TUG1 in EPCs can be transmitted to macrophages through EVs and then promotes macrophage M2 polarization.
A Particle diameter of EPC-derived EVs (bar = 100 nm). B The diameter distribution and concentration of EVs detected by NTA. C Western blot analysis for determination of protein expression of ALIX, TSG101, CD9, GRP94, and albumin. D Uptake of EPC-derived EVs labeled with fluorescent PKH67 by macrophages observed by immunofluorescence microscopy. The PKH67-labeled EVs were red-colored and the DAPI-stained nuclei were blue (scale bar = 25 μm). E The level of TUG1 measured by RT-qPCR after RNase treatment alone. F The expression of TUG1 in EPCs derived EVs and EPC medium determined by RT-qPCR. G Uptake of EPC-derived EVs labeled with Cy3-TUG1 by macrophages observed by immunofluorescence microscopy. The Cy3-TUG1 labeled EVs were red, the DAPI-stained nuclei were blue, and phalloidin labeled macrophages were green (scale bar = 25 μm). H The expression of TUG1 in macrophages cocultured with EPCs derived EVs determined by RT-qPCR. I The expression of TUG1 in EPCs and EPCs derived EVs after pcDNA TUGq-transfected EPCs cocultured with macrophages assessed by RT-qPCR. J RT-qPCR for measurement of mRNA expression of iNOS, TNF-α, IL-10, and Arg-1 in macrophages cocultured with EPCs derived EVs. K The contents of IL-10 and TNF-α protein in the cell culture medium evaluated by ELISA. L The protein expression of iNOS and Arg-1 in macrophages cocultured with EPCs derived EVs measured by western blot analysis. Measurement data were expressed as mean ± standard deviation. Data between two groups were compared using unpaired t-test. One-way ANOVA was adopted for comparison between multiple groups followed by Tukey’s post hoc test. Cell experiments were conducted three times independently. *p < 0.05 vs. cells, control, EPC-CM, EVs-pcDNA, or LPS group.

