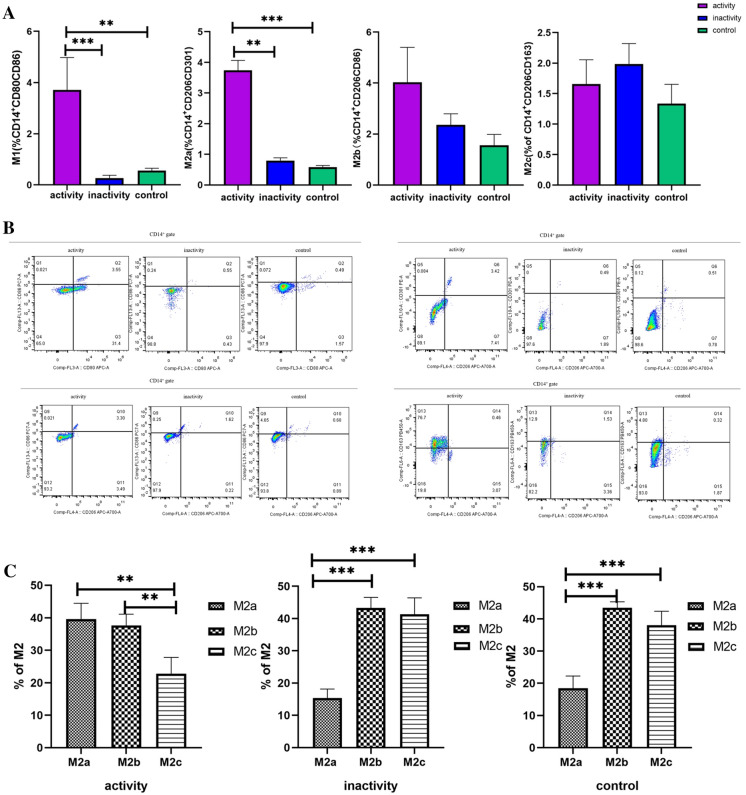
Fig. 2.
Subtypes of macrophages in children with sJIA. A The proportions of M1, M2a, M2b, and M2c in different stages of sJIA children and controls. B Representative flow chart of the proportions of M1, M2a, M2b, and M2c in different stages of sJIA children and controls. C M2a, M2b, and M2c accounted for the proportion of total M2 in the same period of sJIA children and controls. Activity group, n = 12; inactivity group, n = 10; control group, n = 10. *P < 0.05 **P < 0.01 ***P < 0.001

