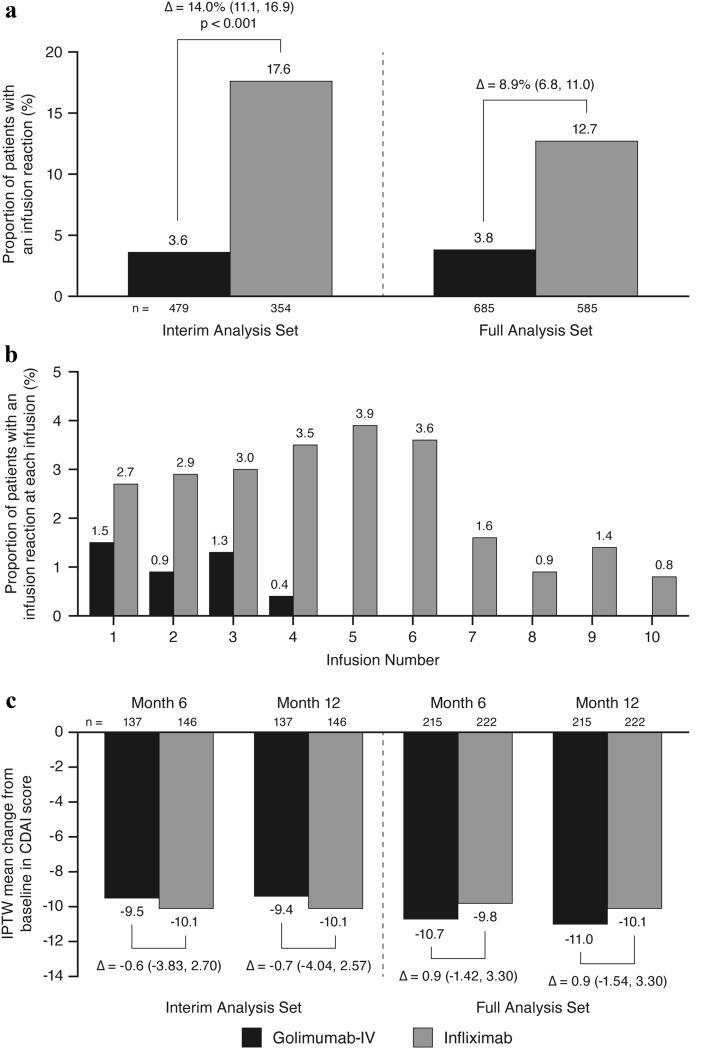
Fig. 2.
The IPTW-adjusted proportion of patients with an infusion reaction through week 52 (a); the IPTW-adjusted proportion of patients with an infusion reaction at each infusion (b); and CDAI and IPTW-adjusted mean change in CDAI score among biologic-naïve patients at month 6 and month 12 (c). In panel c, the mean change from baseline in CDAI is based on ANCOVA after adjusting for both baseline CDAI and IPTW propensity score. ANCOVA analysis of covariance, CDAI Clinical Disease Activity Index, IPTW inverse probability of treatment weighted, IV intravenous

