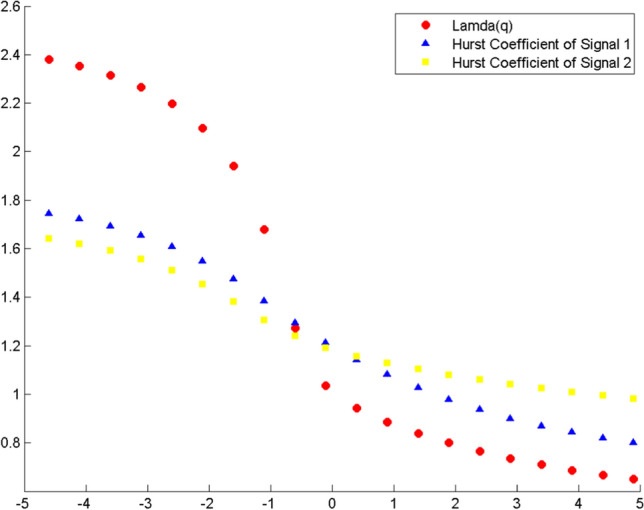
Fig. 11.

Variation of scaling exponent λ(q) with q for F4–O2 electrode combination for Violet color exposure. The combination (red) is plotted against h(q) versus q of the individual signals F4 (blue) and O2 (yellow). The series has monofractal properties if the scaling exponent stays ~ 0.5 at q = 2. Here, λ(q) > 0.5, showing multifractality
