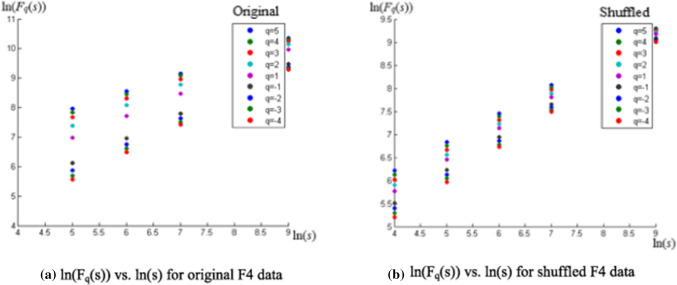
Fig. 3.
a, b Plot of ln(Fq(s)) vs. ln(s) showing different h(q) corresponding to each q; the scaling range being 16 to 1024. For the original series (a), the scaling function Fq and regression slope h(q) is dependent on q, unlike the shuffled series (b) which has a fixed slope H, indicating monofractality

