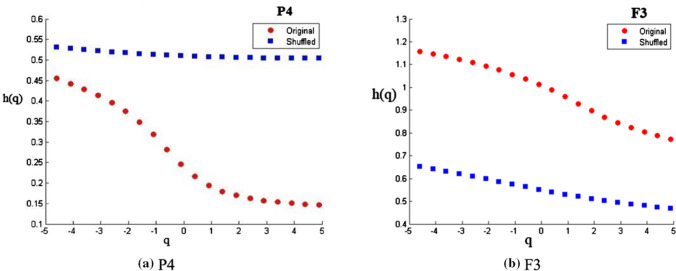
Fig. 4.
The variations of h(q) vs. q for (a) P4 and (b) F3 electrodes. For the original series (red dots) h(q) changes with q (higher for −ve q, lower for + ve). The shuffled series (blue dots) has almost a constant h(q) ~ 0.5. Variance of h(q) shows the presence of long-range correlations in the original series

