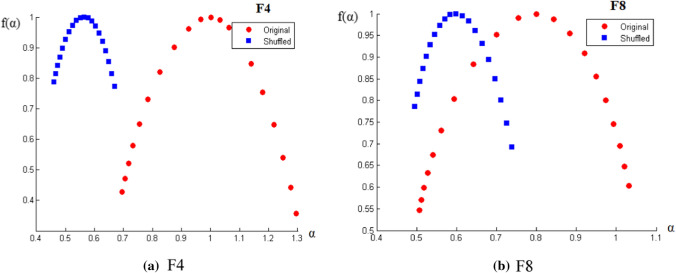
Fig. 7.
a, b The variation of f(α) vs. α for two randomly chosen electrodes (a) F4 and (b) F8, along with shuffled data. This parabolic curve represents the multifractal spectrum where α is q-order singularity exponent and f(α) are its dimensions. Δα (= αmax – αmin) is the spectral width, which, for original series (red) is higher than its shuffled form (blue)—indicates multifractal nature

