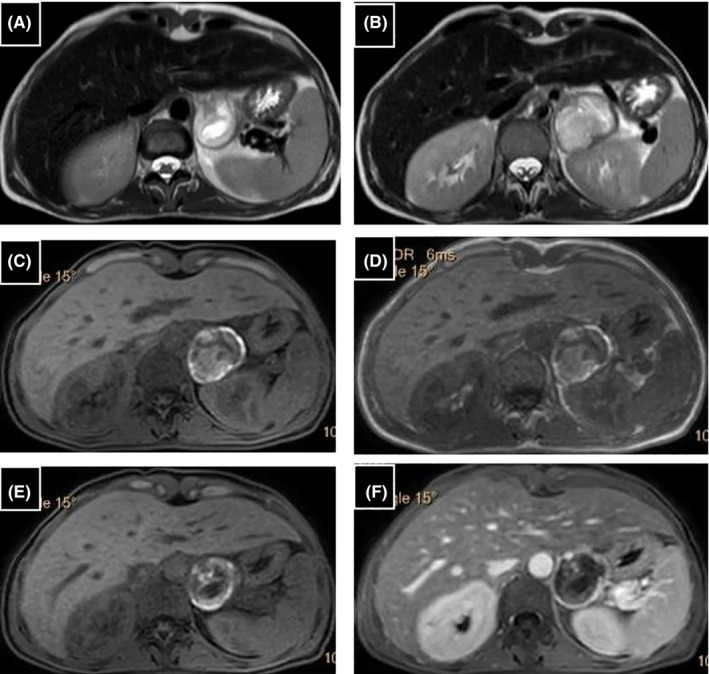
FIGURE 4.

Left adrenal mass: (A, B) T2‐weighted images, (C, E) unenhanced fat‐suppressed axial T1‐weighted images have shown area of increased T1 signal intensity suggesting the hemorrhagic character of the lesion, (D) “in phase” image, (F) T1‐weighted spoiled gradient echo in the axial plane with fat saturation after contrast administration have shown of focal nodular peripheral enhancement (white arrow). T2‐weighted image showing typical high signal intensity in the central necrotic part, which appears hypointense in T1‐weighted images (black arrows)
