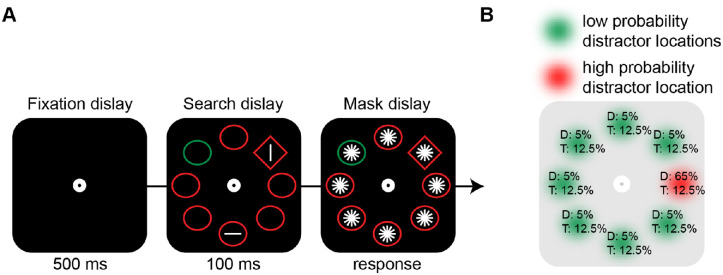
Figure 1.
Experimental paradigm. (A) Graphical illustration of the sequence and timing of stimulus events presented on each trial. For each display participants had to indicate whether a given orientation (e.g., horizontal) was present within the unique shape singleton (in this case, a diamond). The singleton distractor color, when present, was more likely to appear in one location along the imaginary circle. (B) Schematic representation of the spatial regularities of the distractor. Percentages at each location represent the probabilities of the distractor (D) and the target (T) appearing at a given location.

