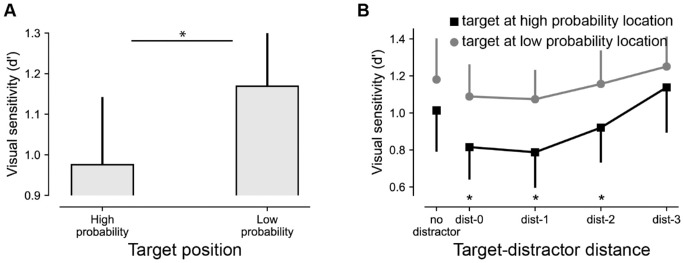
Figure 2.
Statistical learning results in reduced sensitivity for targets at high-probability distractor locations. (A) d′ as a function of target position. (B) d′ for targets at high-probability (black) and low-probability (gray) distractor locations as a function of distance (measures as the number of elements between singletons) between targets and distractors. In all analyses, displays with distractors at high-probability distractor locations were excluded. All error bars here and in subsequent plots represent 95% within-subject confidence intervals (Morey, 2008).

