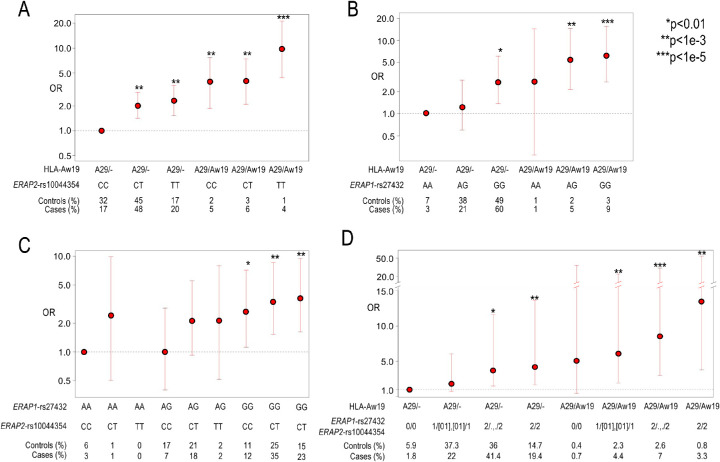
Figure 3.
The combined risk of ERAP1, ERAP2, and two copies of Aw19. Utilizing 286 BSCR cases and 4014 controls from GHS cohort 1 to calculate additive risk while combining risk factors in ERAP1, ERAP2, and Aw19. (A) An additive genotype model of ERAP2 risk signal tagged by rs10044354 and single (A29/–) or double (A29/Aw19) Aw19 copies relative to lowest risk combination of rs10044354-CC and one copy of Aw19 allele (A29). (B) An additive genotype model of ERAP1 risk signal tagged by rs27432 and single (A29/–) or double (A29/Aw19) Aw19 copies relative to lowest risk combination of rs27432-AA and one copy of Aw19 allele (A29). (C) An additive genotype model of ERAP1 risk signal tagged by rs27432 and ERAP2 signal tagged by rs10044354 relative to lowest risk combination of rs27432-AA and rs10044354-CC. (D) An additive genotype model of ERAP1 and ERAP2 risk signals and single (A29/–) or double (A29/Aw19) Aw19 copies relative to lowest risk combination. The genotypes are combined as follows: 0 = ERAP1 and ERAP2 homozygous for protective allele; 1/[01], [01]/1 = either homozygous protective or heterozygous genotypes of both ERAP1 and ERAP2; 2/., ./2 = homozygous risk allele of either ERAP1 or ERAP2; 2/2 = homozygous risk allele of both ERAP1 and ERAP2.

