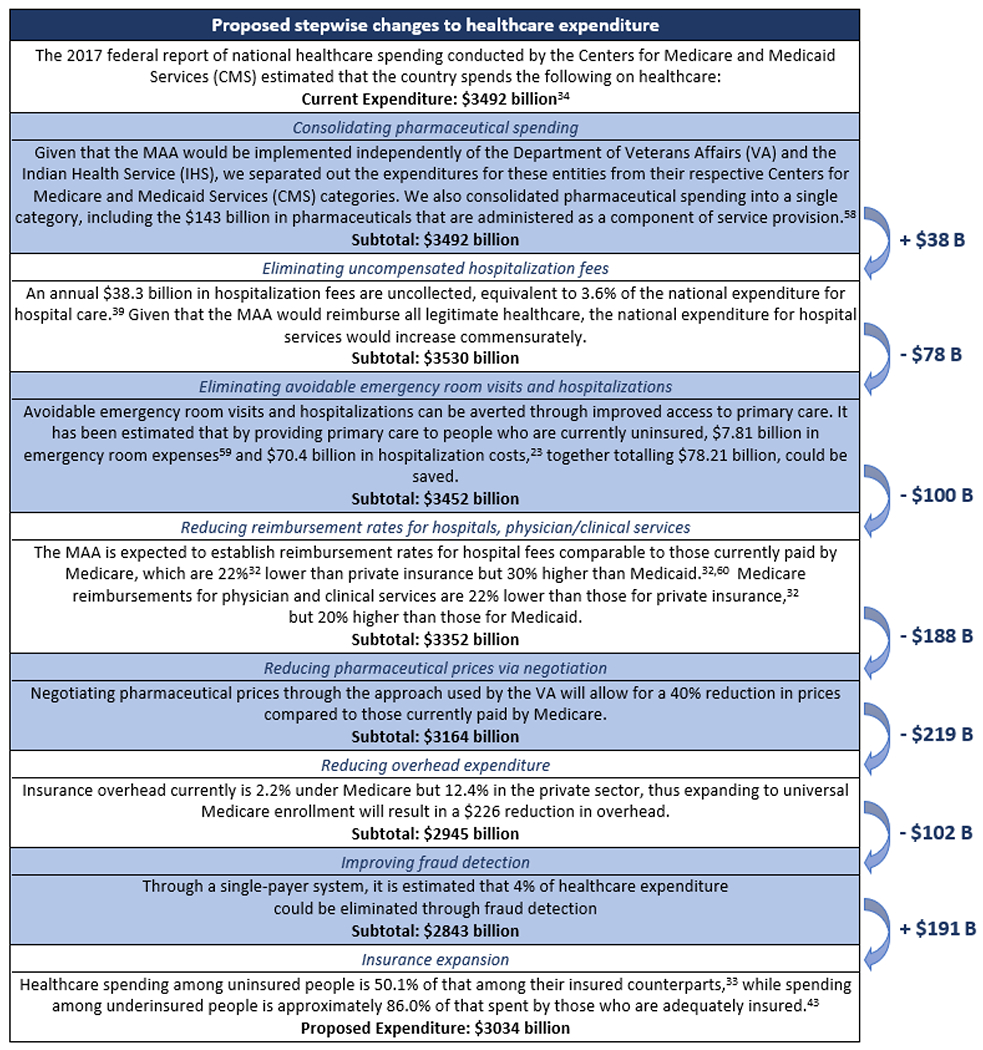
Figure 3: Overview of Single-Payer Healthcare Interactive Financing Tool Calculations.

Arrows indicate changes in total National Healthcare Expenditure upon implementation of each step. Subtotals and changes in National Healthcare Expenditure have been rounded to the nearest billion. Additional details on steps in the enactment of the MAA and relevant calculations are provided in the Appendix and Appendix Tables.
