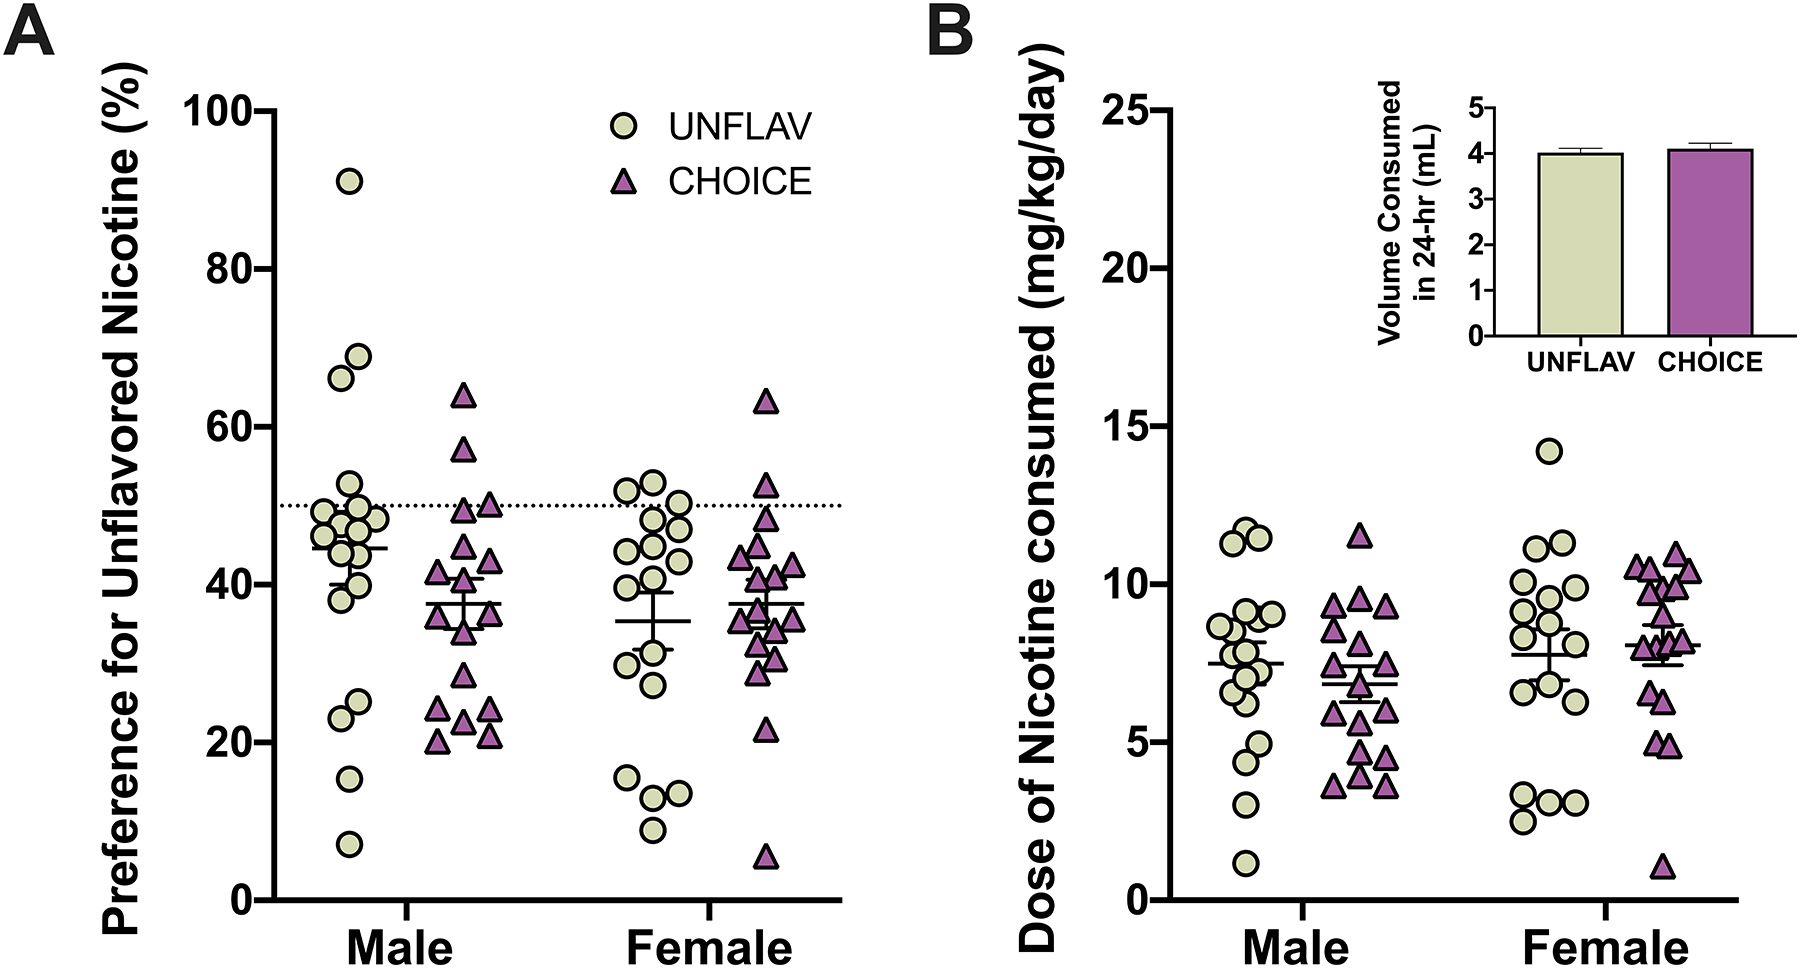
Figure 4. Access to strawberry-flavored nicotine in adolescence does not increase preference for or consumption of unflavored nicotine during maturation.

Data points represent the response of individual animals and lines and error bars represent summary data (mean +/− SEM). In panel B, the inlayed graph represents an average of the volume consumed by mice of both sexes during 24-hours across all maturation drinking sessions. (Male, UNFLAV: n=18, CHOICE: n= 17; Female, UNFLAV: n=17, CHOICE: n=17).
