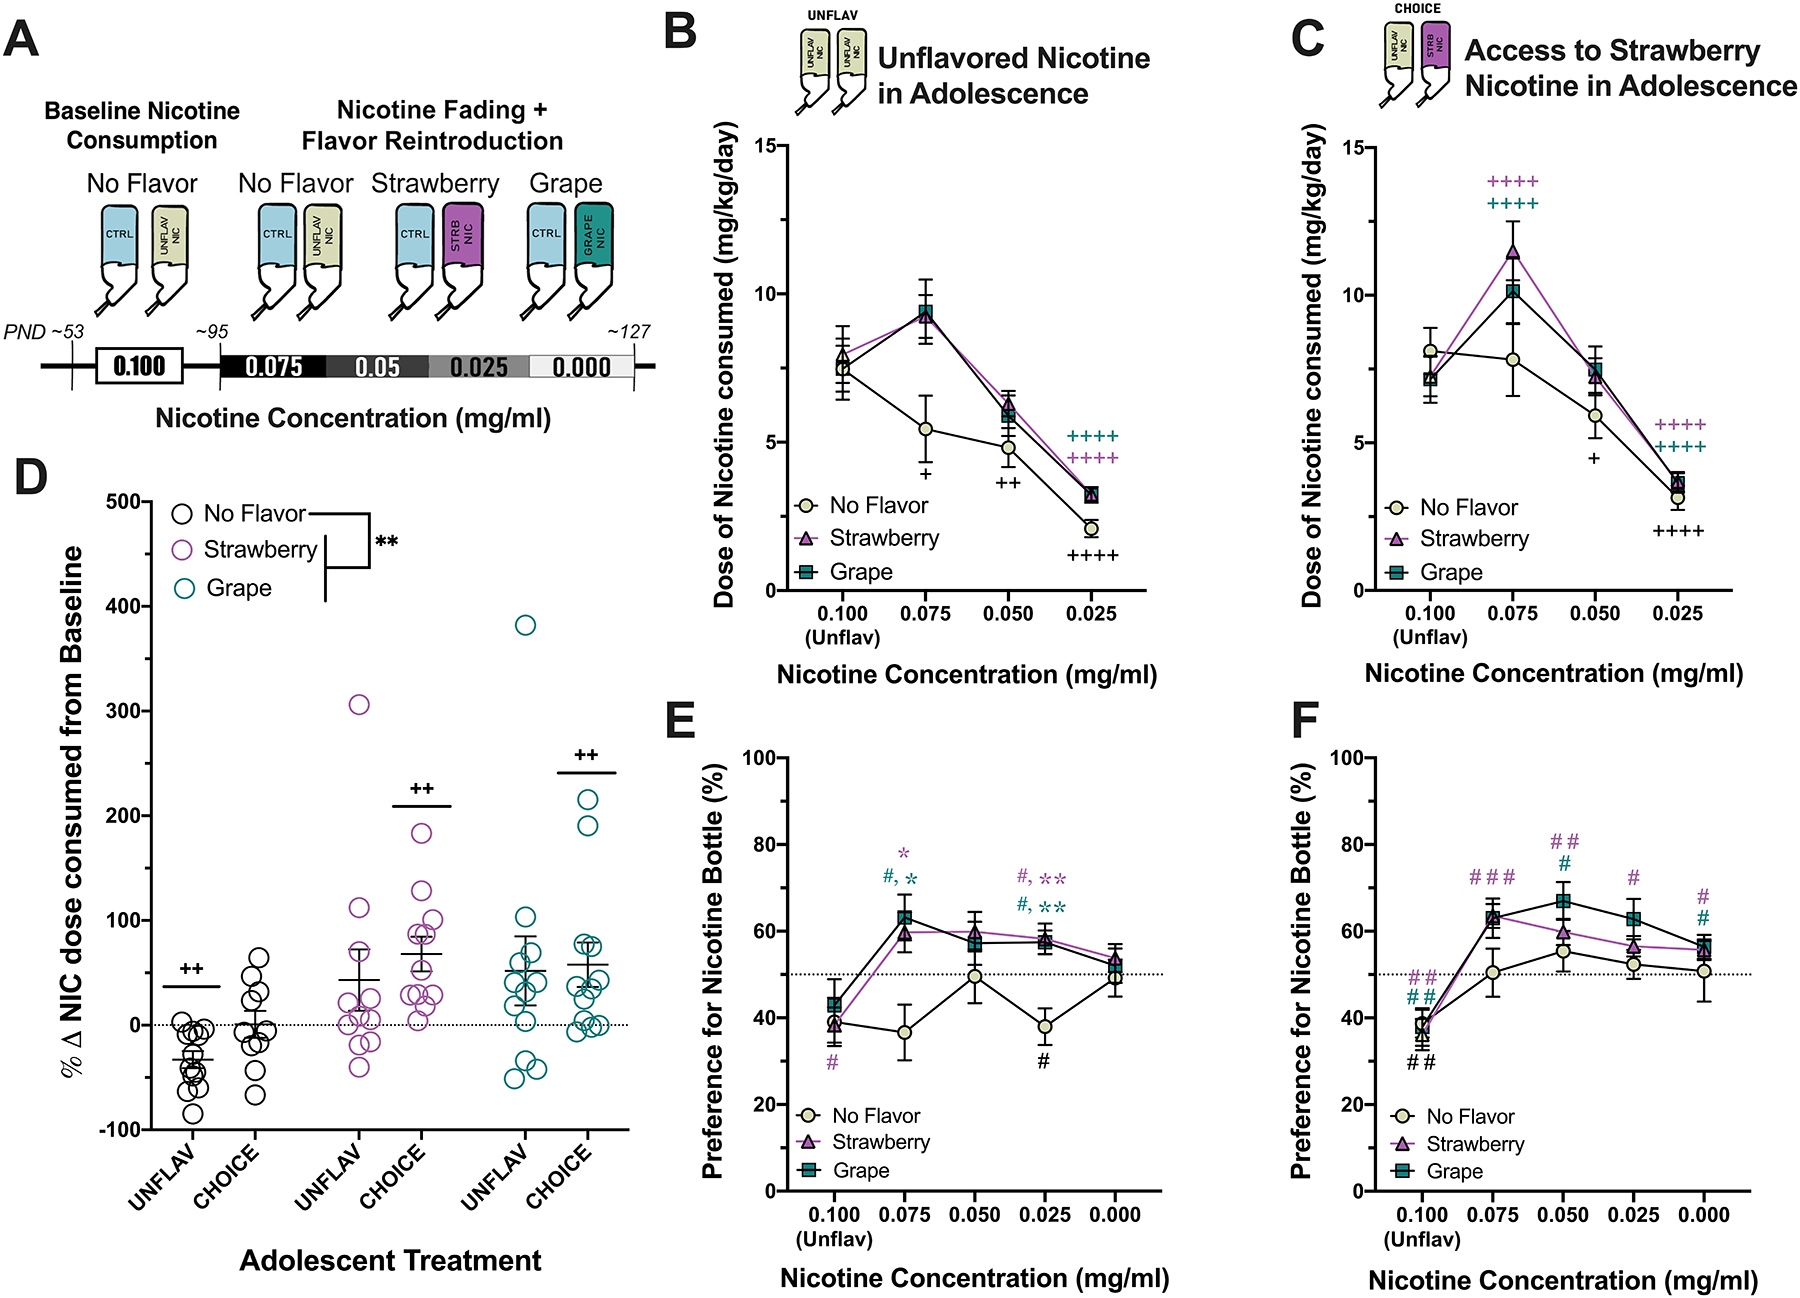
Figure 5. Mice that initiate nicotine use in adolescence with flavored nicotine maintain baseline levels of nicotine consumption for longer than counterparts who initiate with unflavored nicotine and are more sensitive to increased consumption of flavored nicotine in adulthood.

Data from mice that only had access to unflavored nicotine in adolescence (UNFLAV) (B,E) and mice that had access to strawberry flavored nicotine in adolescence (CHOICE) (C, F) are displayed vertically. A) In adulthood (starting at ~PND95), the concentration of nicotine was reduced sequentially, and mice were either left with an unflavored nicotine, had strawberry Kool-Aid® added to the nicotine bottle, or had Grape Kool-Aid® added to the nicotine bottle. All mice had access to a second bottle that did not contain flavor or nicotine. B-C) Line graphs display the dose of nicotine consumed (mg/kg) during the baseline nicotine consumption phase and during the nicotine fading experiment of UNFLAV and of CHOICE mice, respectively (mean +/− SEM). +P < 0.05. ++P < 0.01, and ++++P < 0.0001 represent a significant change from each group’s baseline consumption (Two-way RMANOVA, Sidak’s multiple comparisons test). D) Data displayed is the % change in nicotine consumption from baseline for each mouse when the nicotine solution contained 0.075 mg/ml nicotine. A significant increase in % change of dose consumed by animals that received flavored solutions compared to unflavored solution is indicated by **P < 0.01 near the figure legend (Two way ANOVA, Sidak’s multiple comparisons test). On the graph, ++P < 0.01 indicates a significant change in % consumed of each group from their own baseline consumption (one sample t-test or Wilcoxon test, depending on distribution of data). E-F) Line graphs display the preference for the nicotine bottle (%) during the baseline nicotine consumption phase and during the nicotine fading experiment of UNFLAV and of CHOICE mice, respectively (mean +/− SEM). Preference for the nicotine bottle in UNFLAV group depended on nicotine concentration, flavor and an interaction (Two-way ANOVA, Tukey’s test for multiple comparisons). *P<0.05 and **P<0.01. Whereas, preference for the nicotine bottle in the CHOICE group only depended on nicotine concentration (Repeated Measures Mixed Effects Model). One sample t-tests and Wilcoxon tests were used to measure either aversion to or preference for the nicotine bottle at each concentration (one sample t-tests) # P < 0.05. ## P < 0.01, and ### P < 0.001 represent a significant difference from theoretical chance (i.e., 50% preference) (UNFLAV in adolescence, ‘No Flavor’: n=12, ‘Strawberry’: n= 11, ‘Grape’: n=12; CHOICE in adolescence, ‘No Flavor’: n=10, ‘Strawberry’: n= 11, ‘Grape’: n=12).
