Figure 5.

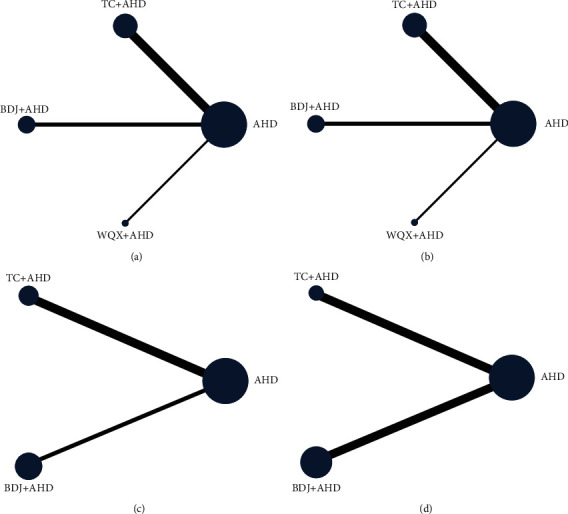
Network of direct comparisons formed by included studies. The node size and line thickness are proportionate to the number of studies: (A) SBP; (B) DBP; (C) NO; (D) ET.

Network of direct comparisons formed by included studies. The node size and line thickness are proportionate to the number of studies: (A) SBP; (B) DBP; (C) NO; (D) ET.