Figure 7.

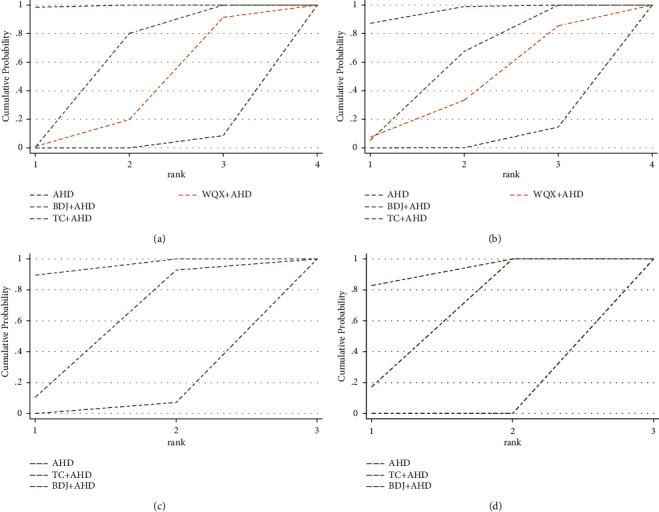
Cumulative ranking plots. Ranking of interventions are proportionate to the size of surface under the dotted line: (a) SBP; (b) DBP; (c) NO; (d) ET.

Cumulative ranking plots. Ranking of interventions are proportionate to the size of surface under the dotted line: (a) SBP; (b) DBP; (c) NO; (d) ET.