Figure 2.

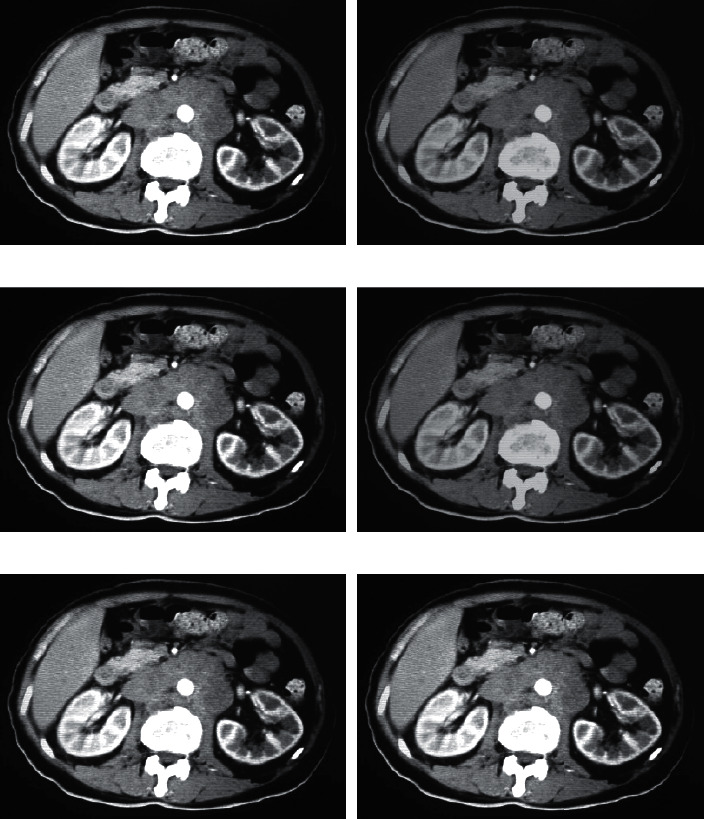
FBP and ASIR reconstruction of the CT scan of the abdomen of ICP patients. A, B, and C represent the plain scan phase, arterial phase, and portal phase, respectively, and A1, B1, and C1 represent FBP, while A2, B2, and C2 represent ASIR.

FBP and ASIR reconstruction of the CT scan of the abdomen of ICP patients. A, B, and C represent the plain scan phase, arterial phase, and portal phase, respectively, and A1, B1, and C1 represent FBP, while A2, B2, and C2 represent ASIR.