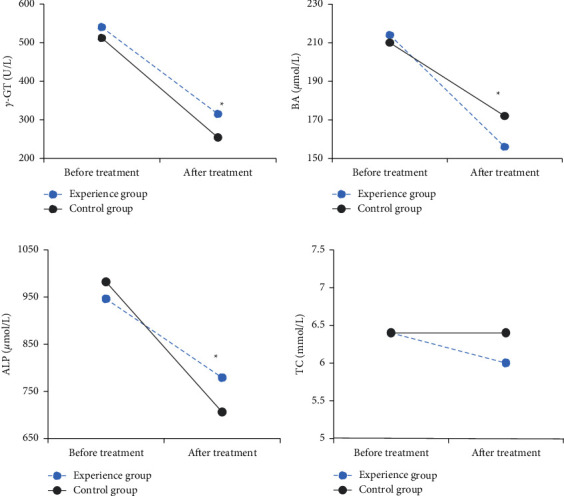
Figure 9.

Changes of blood indicators in the experimental group and the control group before and after treatment. (a) The changes of γ-GT in the two groups of patients, (b) the changes in BA of the two groups of patients, (c) the changes in ALP of the two groups of patients, and (d) the changes in TC of the two groups of patients. ∗indicates considerable differences in blood indicators between the experimental group and the control group (P < 0.05).
