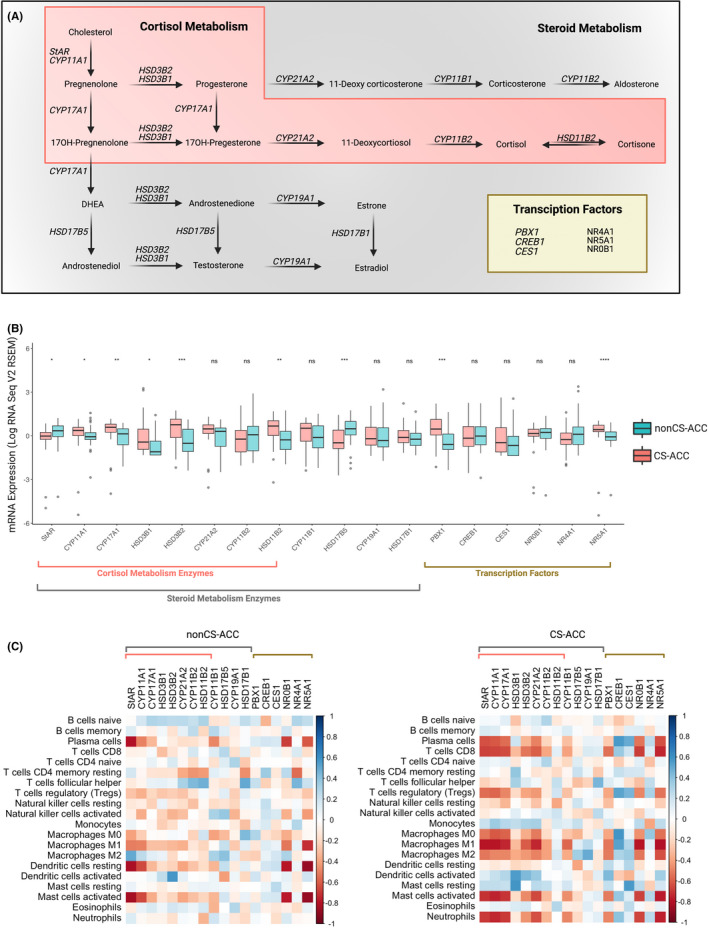
FIGURE 3.

Steroid metabolism gene expression comparison by cortisol secretion and correlations to tumour‐infiltrating immune cells (TIICs). (A) Schematic of steroid metabolism enzyme and transcription factor gene expression. (B) Comparison of steroid metabolism gene expression by cortisol hypersecretion. (C) Heat map of steroid metabolism gene expression correlations with tumour‐infiltrating immune cell (TIIC) subtypes in nonCS‐ACC and CS‐ACC; ns = p‐value ≥ 0.05; *p‐value < 0.05, **p‐value < 0.01, ***p‐value < 0.001, ****p‐value < 0.0001
