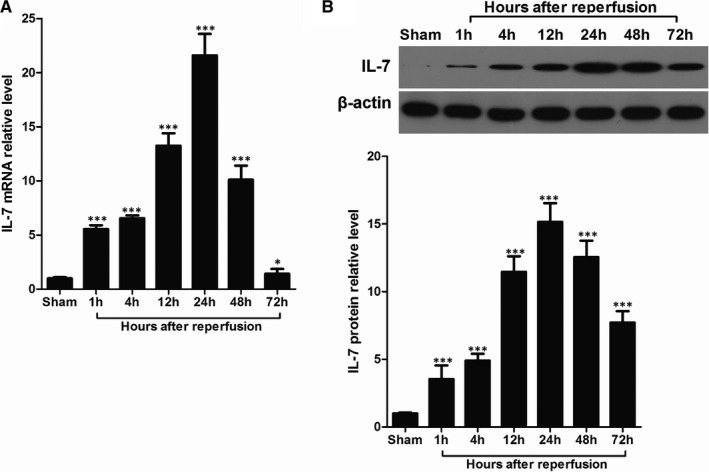
Figure 1.

Induction of IL‐7 in heart tissues after I/R. A, Real‐time RT‐PCR analysis of the indicated IL‐7 mRNA levels in the heart tissues with 30 min of ischaemia and different time of reperfusion. B, Representative images of IL‐7 protein bands using Western blot in the heart tissues with 30 min of ischaemia and different time of reperfusion (upper), and statistical comparison of protein band grey values (lower). Data shown are mean ± SD (n = 5); Compared with sham group, * was P < .05 and *** was P < .001
