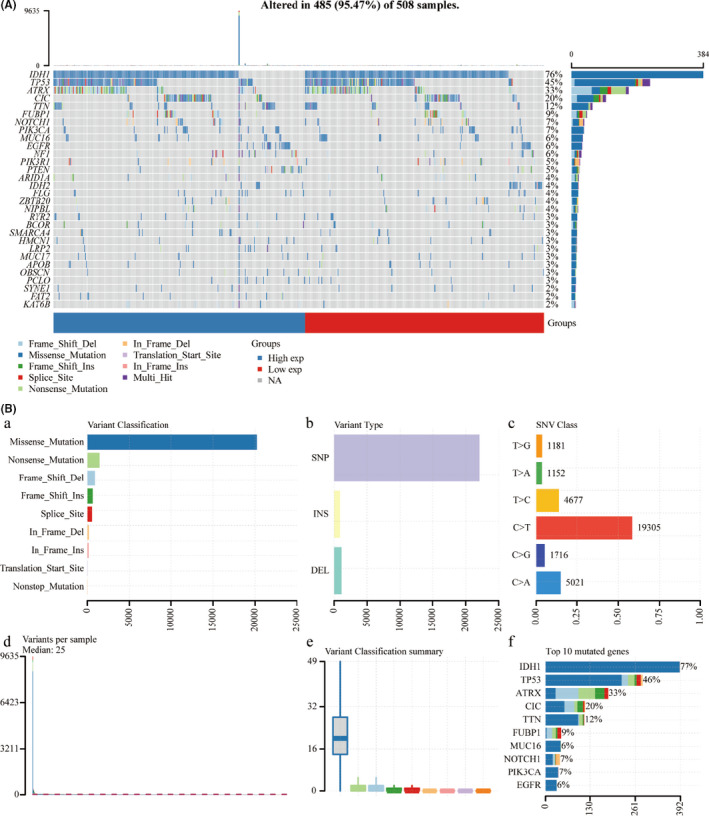
FIGURE 1.

Mutation landscape of the low‐grade glioma (LGG) cohort. Waterfall plot showing the mutation patterns of top 30 mutated genes ordered by the mutation frequency, with different colours with specific annotations at the bottom representing the various mutation types (A). Cohort summary plot displays classification of mutation types according to different categories and tumour mutation burden in samples (B)
