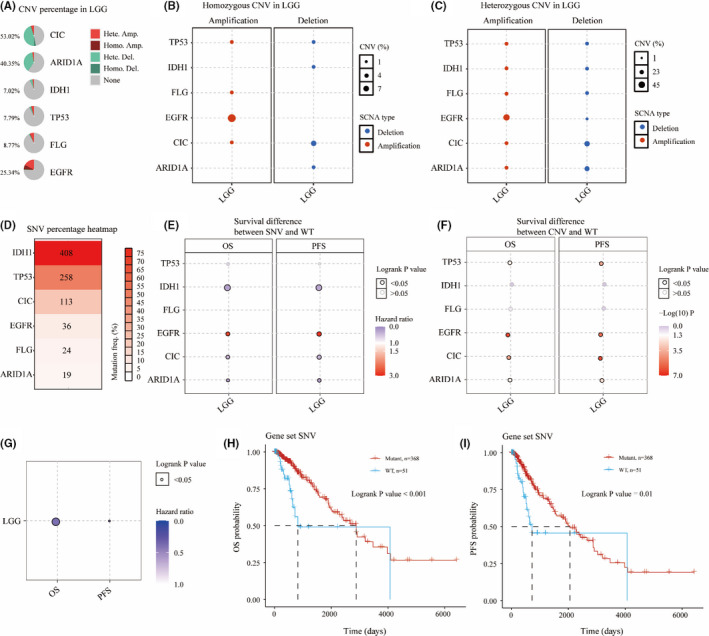
FIGURE 4.

Copy number variation (CNV) and single nucleotide variation (SNV) analyses of six mutated genes in Low‐grade glioma (LGG). CNV percentage of six mutated genes in LGG (A). Homozygous and heterozygous CNV of six mutated genes in LGG (B, C). SNV percentage of six mutated genes in LGG (D). OS and PFS difference between SNV/CNV and WT in LGG (E, F). Survival difference between Gene set SNV and WT (G). OS and PFS probability of gene set SNV in LGG (H, I)
