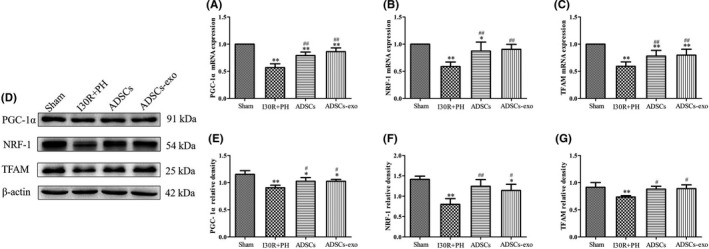
FIGURE 7.

Effect of ADSCs‐exo on mitochondrial biogenesis after HIRI subsequent to hepatectomy. PGC‐1α (A), NRF‐1 (B) and TFAM (C) mRNA expression in each group by RT‐qPCR. PGC‐1α, NRF‐1 and TFAM protein expression in each group by Western blot (D). Quantification of PGC‐1α (E), NRF‐1 (F) and TFAM (G) protein expression in four groups. Results are presented as mean ± SD, * p < 0.05, ** p < 0.01 versus the Sham group. # p < 0.05, ## p < 0.01 versus the I30R+PH group
