
FIGURE 1.
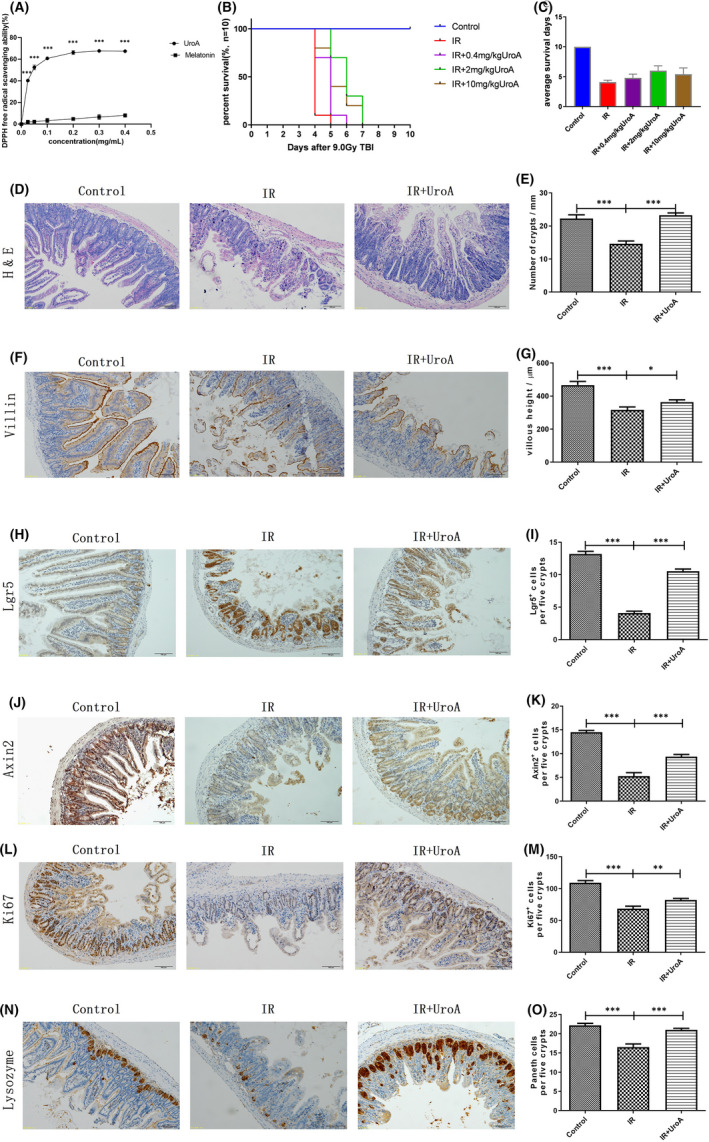
UroA shows excellent antioxidant capacity and improves the survival and intestinal morphology and function of mice after 9.0 Gy TBI. (A) The antioxidant capacity of UroA and melatonin was compared and detected by DPPH. The DPPH free radical scavenging activities by 0.025(p < 0.001, 95% confidence interval: −41.86 to −34.63), 0.05(p < 0.001, 95% confidence interval: −54.13 to −46.34), 0.1(p < 0.001, 95% confidence interval: −61.26 to −53.75), 0.2(p < 0.001, 95% confidence interval: −65 to −57.98), 0.3(p < 0.001, 95% confidence interval: −65.12 to −57.27), 0.4 (p < 0.001, 95% confidence interval: −62.83 to −56.09) mg/ml of UroA were significantly higher than that of melatonin. n = 3 samples per group. ∗∗∗p < 0.001. (B) The survival of mice in three groups. Log‐rank (Mantel‐Cox) test suggested that compared with the IR group, all three doses of UroA (0.4, 2 and 10 mg/kg) significantly developed the survival of mice exposed by 9.0 Gy TBI (p = 0.0076, p < 0.001 and p = 0.0015). (C) The average survival days of mice in five groups. One‐way ANOVA test suggested that compared with the control group, the average survival days of IR group had significantly reduced (p < 0.001, 95% confidence interval: −5.477 to −4.723); compared with the IR group, the average survival days of UroA (0.4, 2 and 10 mg/kg) group had significantly increased (p = 0.1649, 95% confidence interval: −1.566 to 0.166, p < 0.001, 95% confidence interval: −2.766 to −1.034 and p = 0.0009, 95% confidence interval: −2.166 to −0.434). The mice in the control group and the IR group were injected intraperitoneally with phosphate‐buffered saline, and the mice in the IR+UroA group were injected intraperitoneally with 0.4, 2 or 10 mg/kg UroA at 48, 24, 1 h before and 24 h after the 9.0 Gy TBI. n = 10 mice per group. **p < 0.01, ***p < 0.001. (D) Representative haematoxylin and eosin staining images of small intestine. (E) The quantified results of crypts counting. Two‐tailed unpaired t test suggested that compared with the control group, the number of crypts in IR group significantly reduced (***p < 0.001, 95% confidence interval: 4.746‒10.50); compared with the IR group, the numbers of crypts in UroA group significantly increased (***p < 0.001, 95% confidence interval: −10.87 to −6.435). (F) Representative Villin immunostaining images of the small intestinal tract. (G) The quantified results of villous height. Two‐tailed unpaired t test suggested that compared with the control group, the villous height in IR group significantly reduced (***p < 0.001, 95% confidence interval: 94.86‒204.9); compared with the IR group, the villous height in UroA group significantly increased (p = 0.0378, 95% confidence interval: −91.17 to −2.734). n = 5 mice per group. *p < 0.05, **p < 0.01, ***p < 0.001. (H) Representative photomicrographs of intestinal sections showing Lgr5+ positive immunostaining cells stained by IHC. (I) Quantification of Lgr5+ positive immunostaining cells in five intestinal crypts. Two‐tailed unpaired t test suggested that compared with the control group (13.2 ± 0.4), Lgr5+ cells in IR group (4.1 ± 0.3) significantly reduced (***p < 0.001, 95% confidence interval: −10.15 to −8.028); compared with the IR group, Lgr5+ cells in UroA group (10.6 ± 0.3) significantly increased (***p < 0.001, 95% confidence interval: 5.529 to 7.38). (J) Representative photomicrographs of intestinal sections showing Axin2+ positive immunostaining cells stained by IHC. (K) Quantification of Axin2+ immunostaining cells in five intestinal crypts. Two‐tailed unpaired t test suggested that compared with the control group (14.5 ± 0.4), Axin2+ cells in IR group (5.3 ± 0.7) significantly reduced (***p < 0.001, 95% confidence interval: −10.96 to −7.545); compared with the IR group, Axin2+ cells in UroA group (9.4 ± 0.5) significantly increased (***p < 0.001, 95% confidence interval: 2.289 to 5.938). (L) Representative photomicrographs of intestinal sections showing Ki67+ positive immunostaining cells stained by IHC. (M) Quantification of Ki67+ immunostaining cells in five intestinal crypts. Two‐tailed unpaired t test suggested that compared with the control group (109.2 ± 3.4), Ki67+ cells in IR group (68.4 ± 3.9) significantly reduced (***p < 0.001, 95% confidence interval: −52.76 to −28.84); compared with the IR group, Ki67+ cells in UroA group (82.1 ± 2.5) significantly increased (p = 0.0095, 95% confidence interval: 3.964 to 23.44). (N) Representative photomicrographs of intestinal sections showing Lysozyme positive immunostaining cells stained by IHC. (O) Quantification of Lysozyme positive immunostaining cells in five intestinal crypts. Two‐tailed unpaired t test suggested that compared with the control group (22.2 ± 0.5), paneth cells in IR group (16.5 ± 0.8) significantly reduced (***p < 0.001, 95% confidence interval: −7.612 to −3.668); compared with the IR group, paneth cells in UroA group (21.0 ± 0.4) significantly increased (***p < 0.001, 95% confidence interval: 2.637 to 6.31). Results are presented as mean ±SD of n = 5 mice per group. *p < 0.05, **p < 0.01, ***p < 0.001. scale bar: 100 μm