Fig. 3.
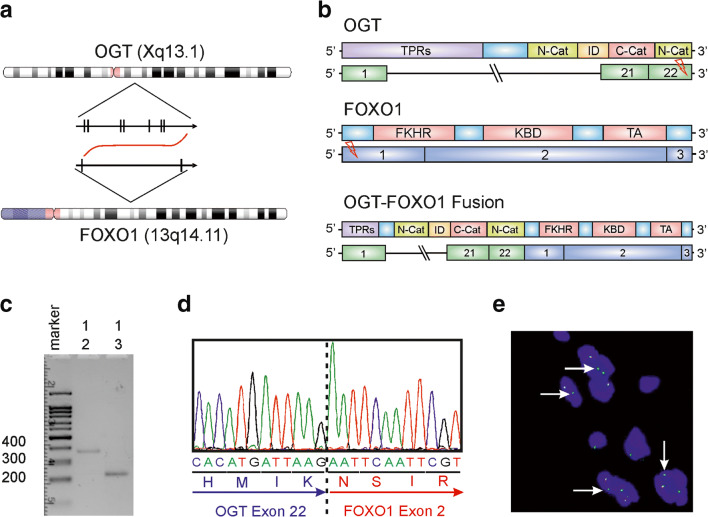
Molecular analysis of OGT-FOXO1 fusion. a Chromosomal location and orientation of OGT and FOXO1. b Schematic image of the exons and domain composition of the partner genes and fusion gene. The breakpoints were found in exon 22 of OGT and exon 1 of FOXO1. c–d RT-PCR was performed using a forward primer from OGT (primer 1) and two different reverse primers from FOXO1 (primers 2 and 3). Each primer combination revealed a band of a fusion product between 200 and 400 bp(C). Sanger sequencing of the fusion product confirmed the same sequence as detected by NGS (D). e Fluorescence in situ hybridization. FISH analysis was performed using a FOXO1 Break Apart Probe and revealed an unusual pattern with one fused signal and one single green signal (white arrow)

