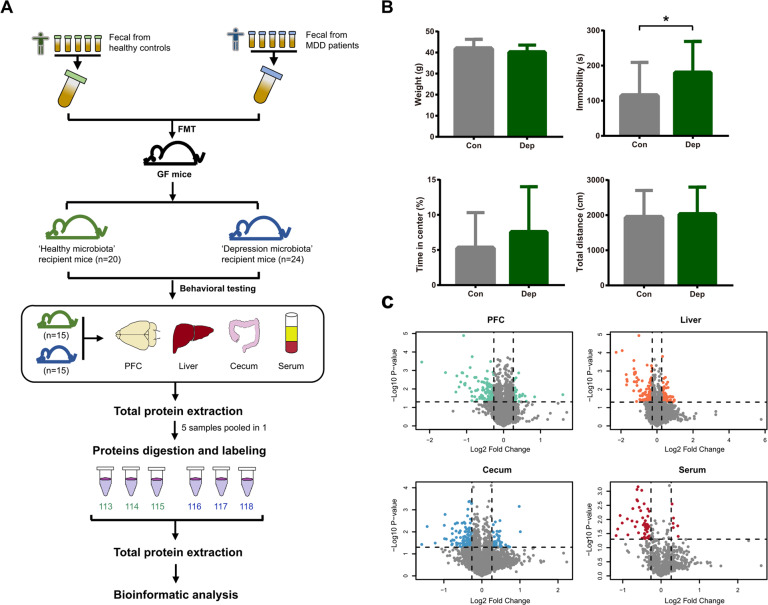
Fig. 1. Workflow of this study.
A Experimental and proteomics workflow of the study. B There were no differences in weight, total motion distance, and percentage of time spent in the center of the OFT between “depression microbiota” and “healthy microbiota” recipients. The “depression microbiota” recipients displayed an increased duration of immobility in the FST compared with “healthy microbiota” recipients (*p < 0.05, t test). The gray bars indicate the “healthy microbiota” recipients (n = 20). The green bars indicate the “depression microbiota” recipients (n = 24). C Volcano plots of detected protein abundance from the four tissues. Green, orange, blue, and red dots indicate DE proteins in the PFC, liver, cecum, and serum, respectively.

