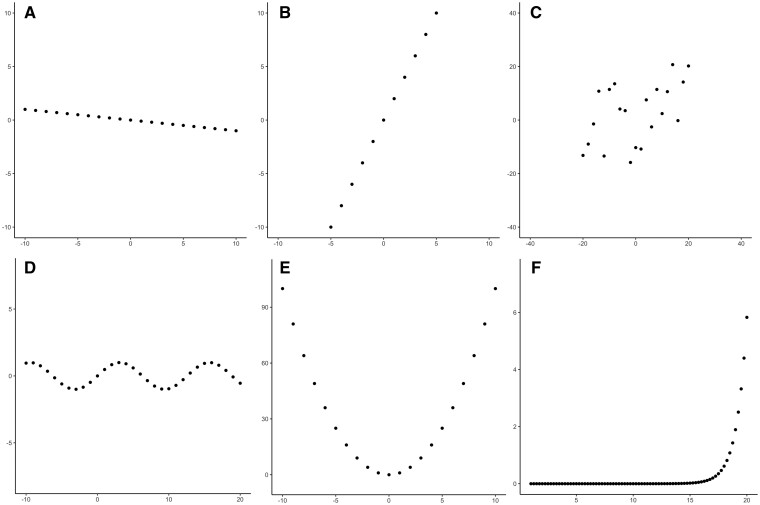
FIGURE 1:
Different shapes of data and their correlation coefficients. (A) Linear association with r = −1. (B) A linear association with r = 1. (C) A scatterplot through which a straight line could plausibly be drawn, with r = 0.50. (D) A sinusoidal association with r = 0. (E) A quadratic association with r = 0. (F) An exponential association with r = 0.50.

