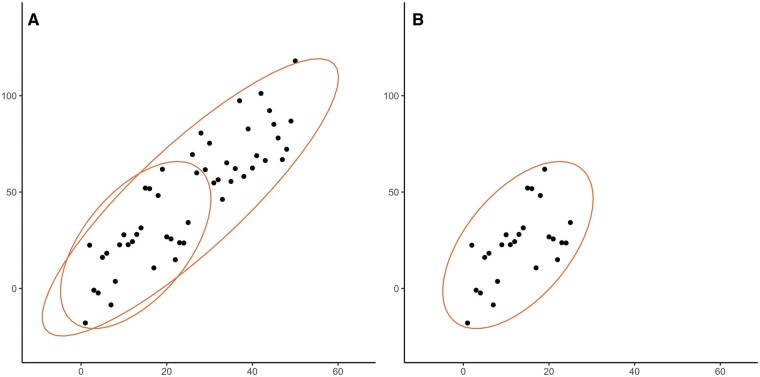
FIGURE 2:
The effect of the range of observations on the correlation coefficient, as shown with ellipses. (A) Set of 50 observations from hypothetical dataset X with r = 0.87, with an illustrative ellipse showing length and width of the whole dataset, and an ellipse showing only the first 25 observations. (B) Set of only the 25 lowest observations from hypothetical dataset X with r = 0.57, with an illustrative ellipse showing length and width.

