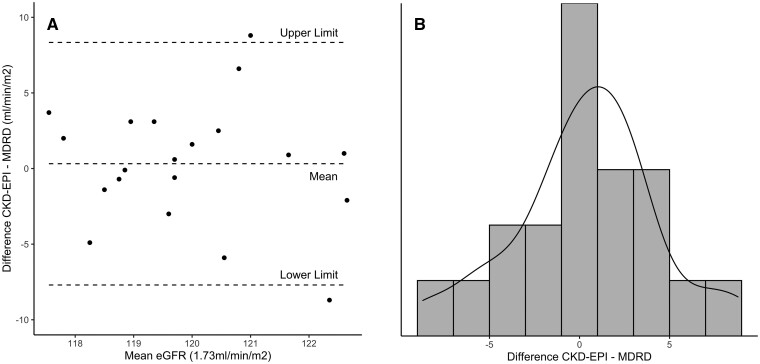
FIGURE 4:
Plots to check assumptions for the limits of agreement. (A) The Bland–Altman plot for the assumption that the mean and SD of the differences are constant over the range of observations. In our case, we see that the mean of the differences appears to be equal along the x-axis; i.e., these datapoints could plausibly fit the horizontal line of the total mean across the whole x-axis. Nonetheless, the SD does not appear to be distributed equally: the means of the differences at the lower values of the x-axis are closer to the total mean (thus a lower SD) than the means of the differences at the middle values of the x-axis (thus a higher SD). Therefore, the first assumption is not met. The limits of agreement and the mean are added as dashed (- - -) lines. (B) A histogram of the distribution of differences to ascertain the assumption of whether the differences are normally distributed. In our case, the observations follow a normal distribution and thus, the assumption is met.

