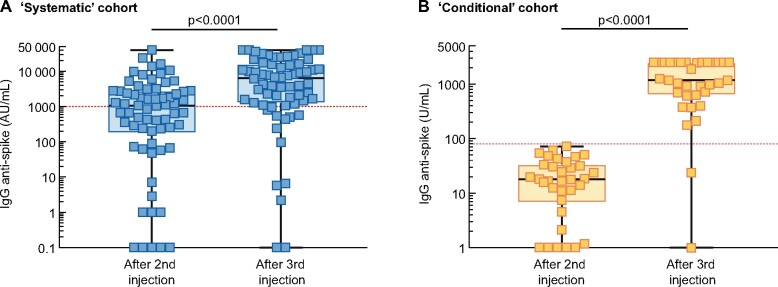
FIGURE 2:
Anti-S IgG titre after the second and third BNT162b2 doses in the (A) systematic and (B) conditional cohorts. Each patient is represented by a square. The red dashed line represents the cut-off level for high response to vaccine (anti-S IgG antibody >1000 AU/mL in the systematic cohort and >80 U/mL in the conditional cohort). Comparisons were made using the Mann–Whitney U test. Logarithmic scale.

