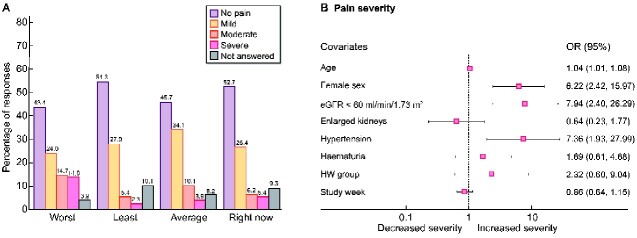
FIGURE 2:
(A) BPI pain severity score for each of the four domains; worst pain, least pain and average pain over the last 2 weeks and pain right now (current pain), numbers on top of bars indicate percentage. (B) Demographic and clinical predictors of average BPI pain severity score. Age was centred around the mean. X-axis represents the OR. Advancing age, female sex, CKD Stage 3 or worse, and hypertension predicted increased pain severity.

