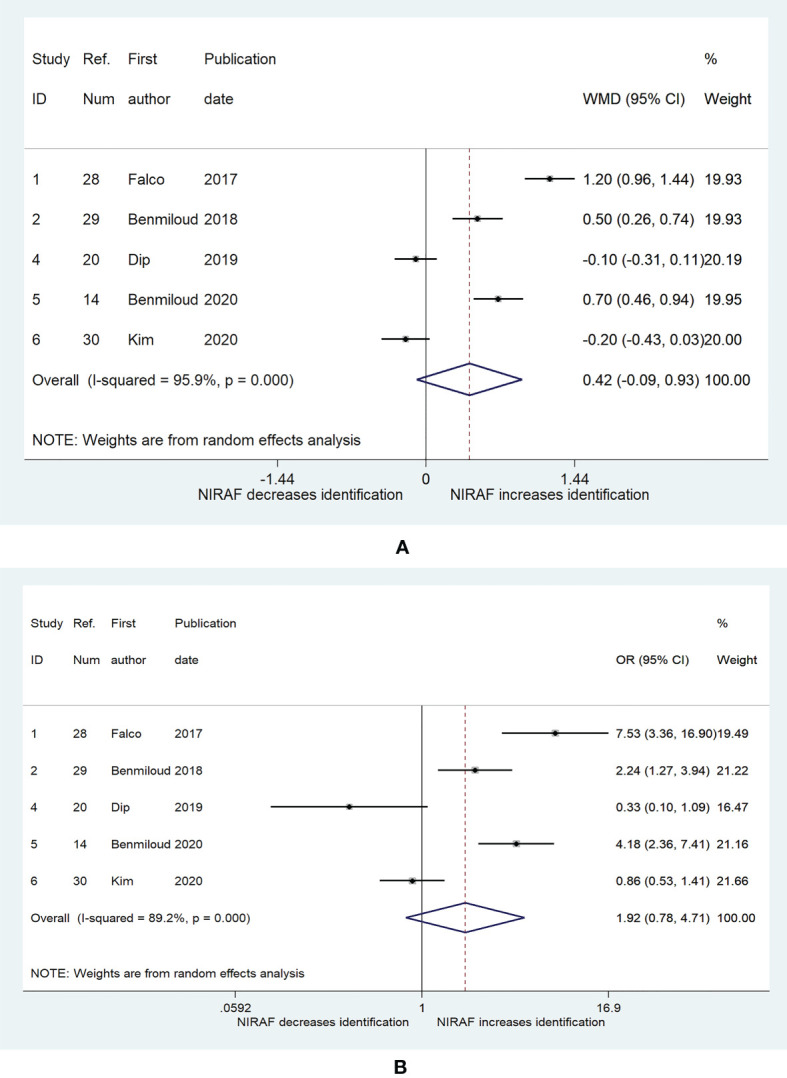
Figure 2.

The relationship between near-infrared autofluorescence and the number of identified PG. (A) the weighted mean deviation of the number of identified parathyroid between near-infrared autofluorescence group and naked eye group. (B) the odds ratio (patients with three or more identified parathyroid glands vs. patients with two or less identified parathyroid glands) between near-infrared autofluorescence group and naked eye group. The shaded areas represent the weight of the relevant study in pooling the results; the error bars represent the 95% confidence interval.
