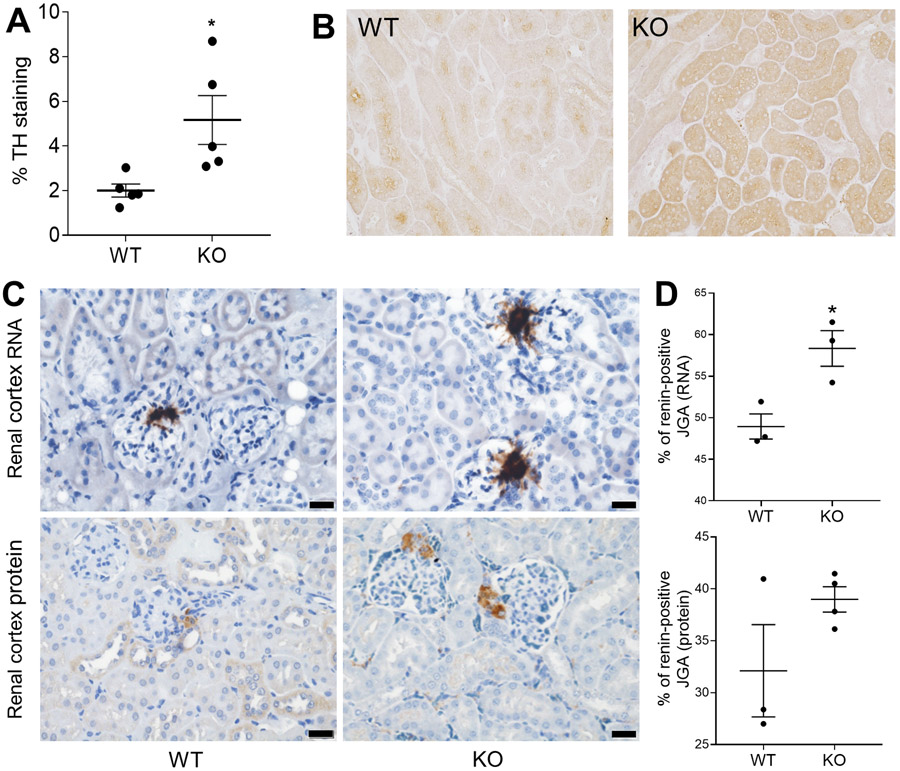
Figure 3. Renal renin and tyrosine hydroxylase in the miR-181a/b-1 knockout.
A, Percentage area of the image positively stained for tyrosine hydroxylase (TH) in WT and miR-181a/b-1 KO mice. B, Representative micrograph showing TH staining (dark brown) in cortical tubules (scale bar=50 μm) of WT and miR-181a/b-1 KO mice. C, Representative images of in situ hybridisation (top images) and immunohistochemistry (bottom images), with renin shown as brown stain (scale bars=20μm). D, Percentage of renin mRNA positive juxtaglomerular apparatus (JGA) and renin protein in the JGA. Bars represent average values ± SEM. Statistical analysis was conducted using one-way analysis of variance. Comparisons are between strains *P<0.05 compared to WT. n=2-5/group.

