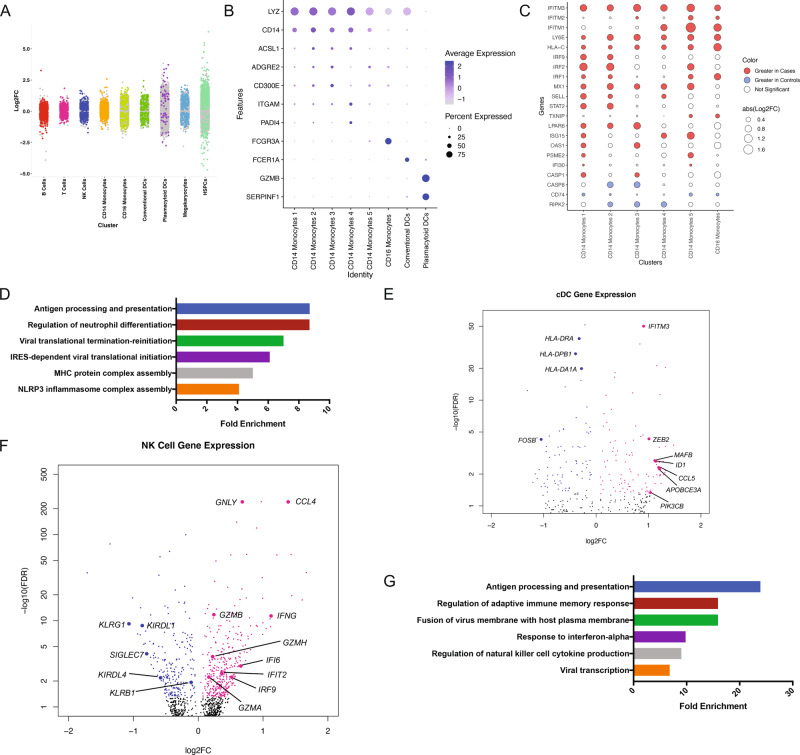
Fig. 2. Genes expression differences between cord blood mononuclear cells from infants born to mothers with SARS-CoV2 infection (cases) or mothers without SARS-CoV-2 infection (controls).
a Strip plot displaying differential gene expression between cases and controls. Colored dots represent significant genes (FDR < 0.05). X-axis displays select CBMC cell types. N = 3 samples per group. b Dot plot of marker gene expression across monocyte cell clusters (CD14+ and CD16+). Y-axis displays marker genes and X-axis displays cell clusters. Relative size of dots represents the percentage of gene expression within a cell cluster, and the relative color of dots represents average expression. c Dot plot of highly variable genes in CD14+ and CD16+ monocytes between cases and controls. All significant genes FDR < 0.05. Red indicates an increase in expression in cases and blue indicates an increase in expression in controls. N = 3 samples per group. d Select Gene Ontology (GO; Biological Pathway) results for differentially expressed genes between cases and controls in CD14+ monocytes. GO categories have FDR < 0.05. X-axis indicates fold enrichment relative to the reference gene set of all expressed genes in the dataset. e Volcano plot of DGE between cases and controls in conventional dendritic cells (cDCs). Colored dots indicate statistical significance (FDR < 0.05). Positive log 2 FC (pink dots) indicates higher expression in cases, and negative log 2 FC (blue dots) indicates higher expression in controls. N = 3 samples per group. f Volcano plot of DGE between cases and controls in natural killer (NK) cells. Colored dots indicate statistical significance (FDR < 0.05). Positive log 2 FC (pink dots) indicates higher expression in cases, and negative log 2 FC (blue dots) indicates higher expression in controls. N = 3 samples per group. g Select Gene Ontology (GO; Biological Pathway) results for differentially expressed genes between cases and controls in NK cells. GO categories have FDR < 0.05. X-axis indicates fold enrichment relative to the reference gene set of all expressed genes in the dataset.

