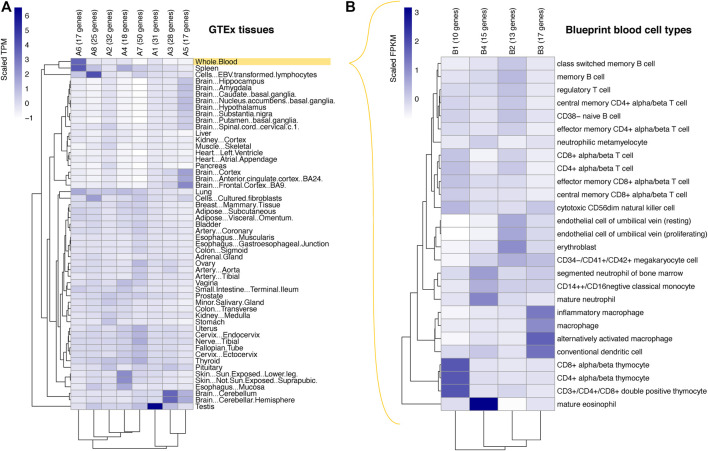
FIGURE 2.
Expression patterns of the prioritised genes. Heatmaps showing the results of k-means clustering of COGS-prioritised genes (scores >0.3) based on their relative expression levels across the tissues profiled by the GTEx consortium (A) and across primary blood cell types profiled by the BLUEPRINT consortium (B). Relative gene expression in (A) represents gene-level TPM values scaled across all GTEx genes, and in (B) gene-level RPKM values scaled across genes with the top 25% of expression in the BLUEPRINT dataset. Each cell in the heatmap represents a cluster, with the gene-to-cluster assignments listed in Supplementary Table S5A, B, respectively. Abbreviations: FPKM, fragments per kilobase of transcript per million mapped reads, TPM, transcripts per million.

