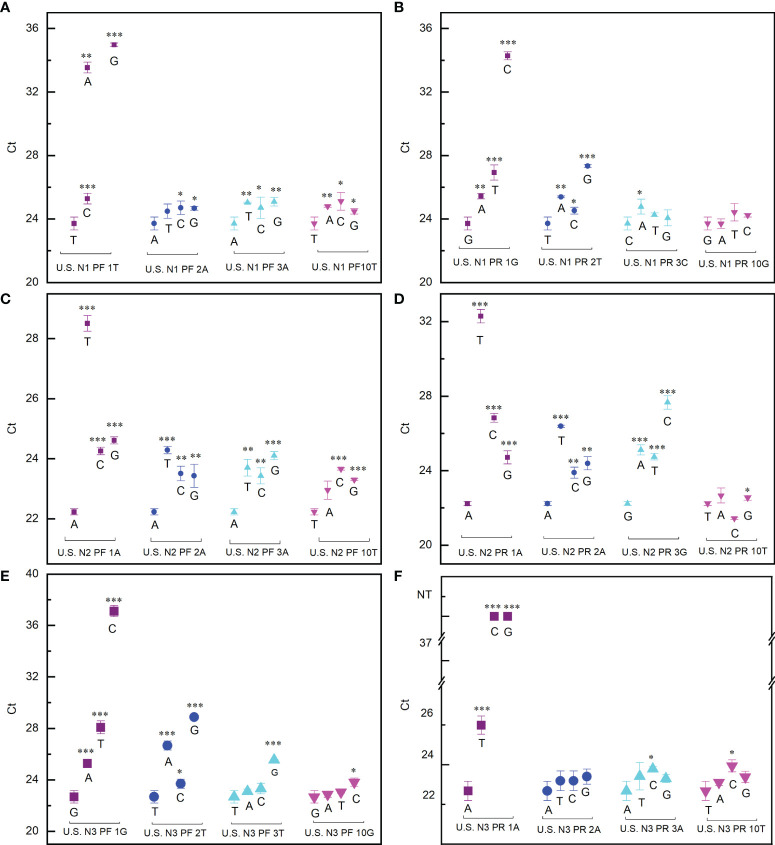
Figure 1.
Effect of mismatch between primers and template on PCR reaction. (A, B) Ct values detected when the US N1 forward primer (A) and reverse primer (B) contained mismatch with the template. (C, D) Ct values detected when the US N2 forward primer (C) and reverse primer (D) contained mismatch with the template. (E, F) Ct values detected when the US N3 forward primer (E) and reverse primer (F) contained mismatch with the template. The purple square, blue dot, cyan upper triangle, and magenta lower triangle represent the first, second, third, and 10th (middle position) base of the 3′ end of the primer, respectively. Student’s t-test by SPSS 15 was used for data analysis. A p-value < 0.05 was considered statistically significant. *p < 0.05; **p < 0.01; ***p < 0.001.

