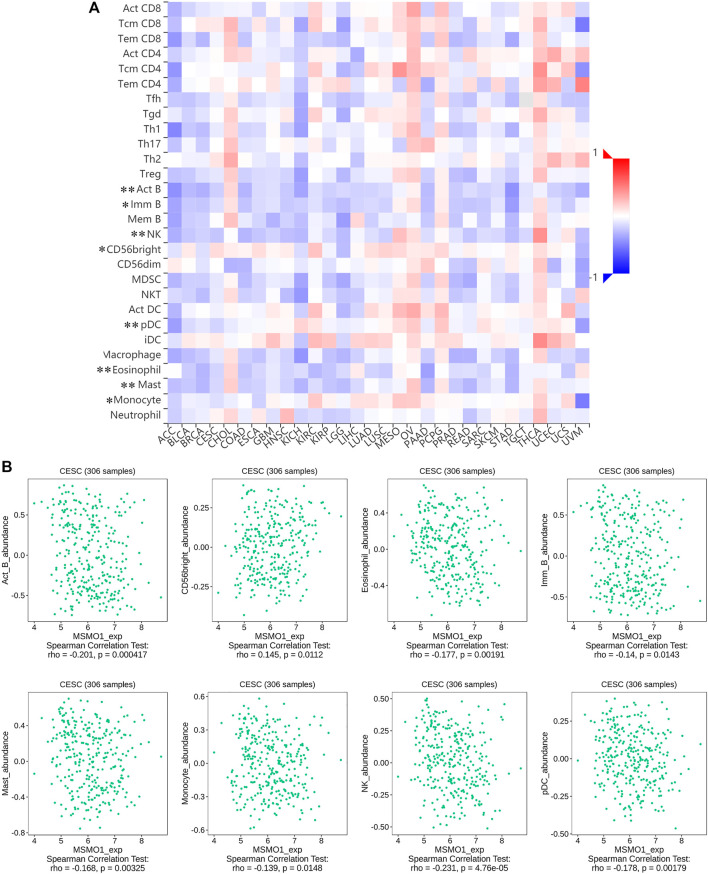
FIGURE 12.
Correlation between MSMO1 expression levels and immune cell subsets. (A) The black asterisks in the correlation heatmap indicate immune cell types significantly associated with MSMO1 expression levels in CESC cohorts, respectively. (*p < 0.05; **p < 0.01). (B) The dot plots displayed the correlations between MSMO1 expression levels and immune cell subsets in CESC.

