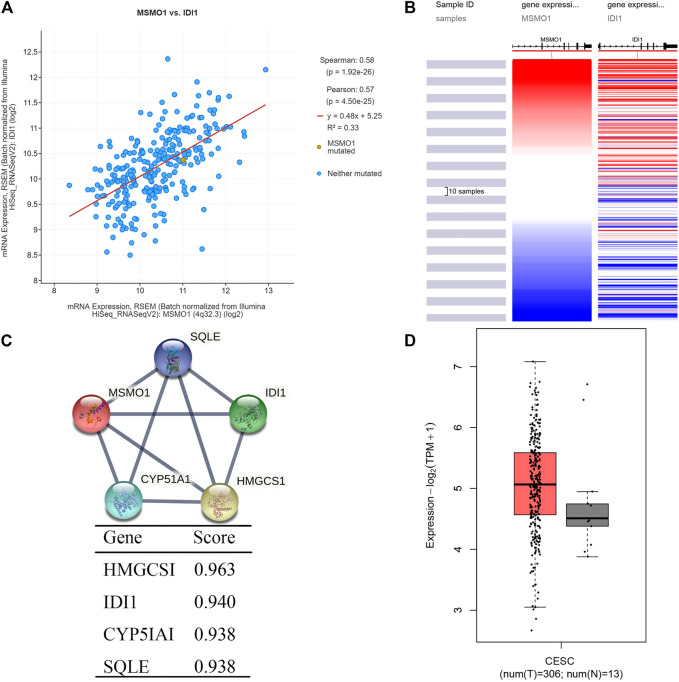
FIGURE 8.
Analysis of co-expressed genes with MSMO1. (A) Schematic diagram of the correlation between IDI1 gene and MSMO1 co-expression in cBioPortal. (B) Heat map of IDI1 and MSMO1 expression in UCSC Xena. (C) The interaction network diagram of co-expressed proteins with MSMO1 in STRING. (D) In GEPIA2, the expression difference map of the IDI1 gene in CESC.

