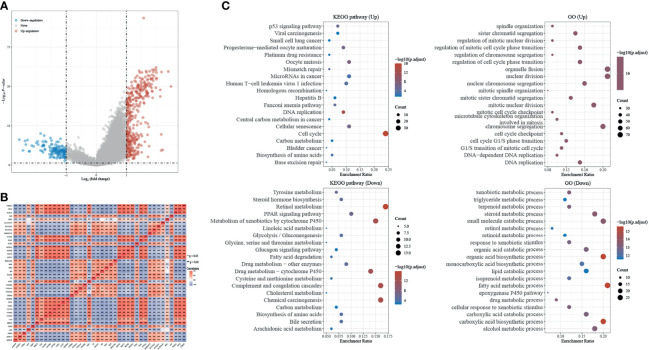
Figure 5.
Identification and GSEA analysis of DEGs in H2AFZhigh and H2AFZlow group. (A) Volcano plot showing DEGs in H2AFZhigh and H2AFZlow group (|log2FC| > 2, p < 0.05) in TCGA-LIHC cohort. p-values were adjusted. (B) Spearman correlation analysis of top 20 upregulated genes and top 20 downregulated genes. (C) Significantly enriched GO annotations and KEGG pathways of DEGs.

